Introduction
Money talks but it can’t sing, it can’t dance and it can’t walk. Pop star, Neil Diamond, understood this long before the coronavirus put our lives on hold. But the plan the Fed and Congress put in place to rain money everywhere will hopefully allow us to sing, dance and walk until this crisis is over.
First, my thoughts and prayers go out to everyone impacted by the pandemic, especially patients and all the brave medical personnel on the front lines. In this new reality, it may seem like working from home in blue jeans is going to last forever; it won’t. We’ll eventually get back to normal, but I believe Congress won’t be able to bail out corporations as easily today as it did with banks, airlines and cruise lines during the 2008-09 global financial crisis. It is my opinion that taxpayers and voters won’t put up with airlines spending 96 percent of their free cash flow on stock buybacks and they won’t tolerate helping “American” cruise lines stay afloat, when those companies—domiciled offshore—pay almost no U.S. taxes.
When we got through the global financial crisis in 2009, I was emotionally exhausted. But I consoled myself with the fact that it would be at least a quarter of a century before we’d have to live through volatility like that again. But here we are, barely a decade later, and it’s déjà vu all over again. Just a few weeks ago, we had a perfect storm of plummeting stocks, plunging oil prices and rock bottom interest rates all at the same time. This perfect storm caused the worst liquidity crisis since 2008. At one point there was a bid/offer spread of 100 basis points on U.S. Treasuries, leaving the rest of the bond market frozen. An entire frightening week went by in which no corporation could borrow money in the credit markets.
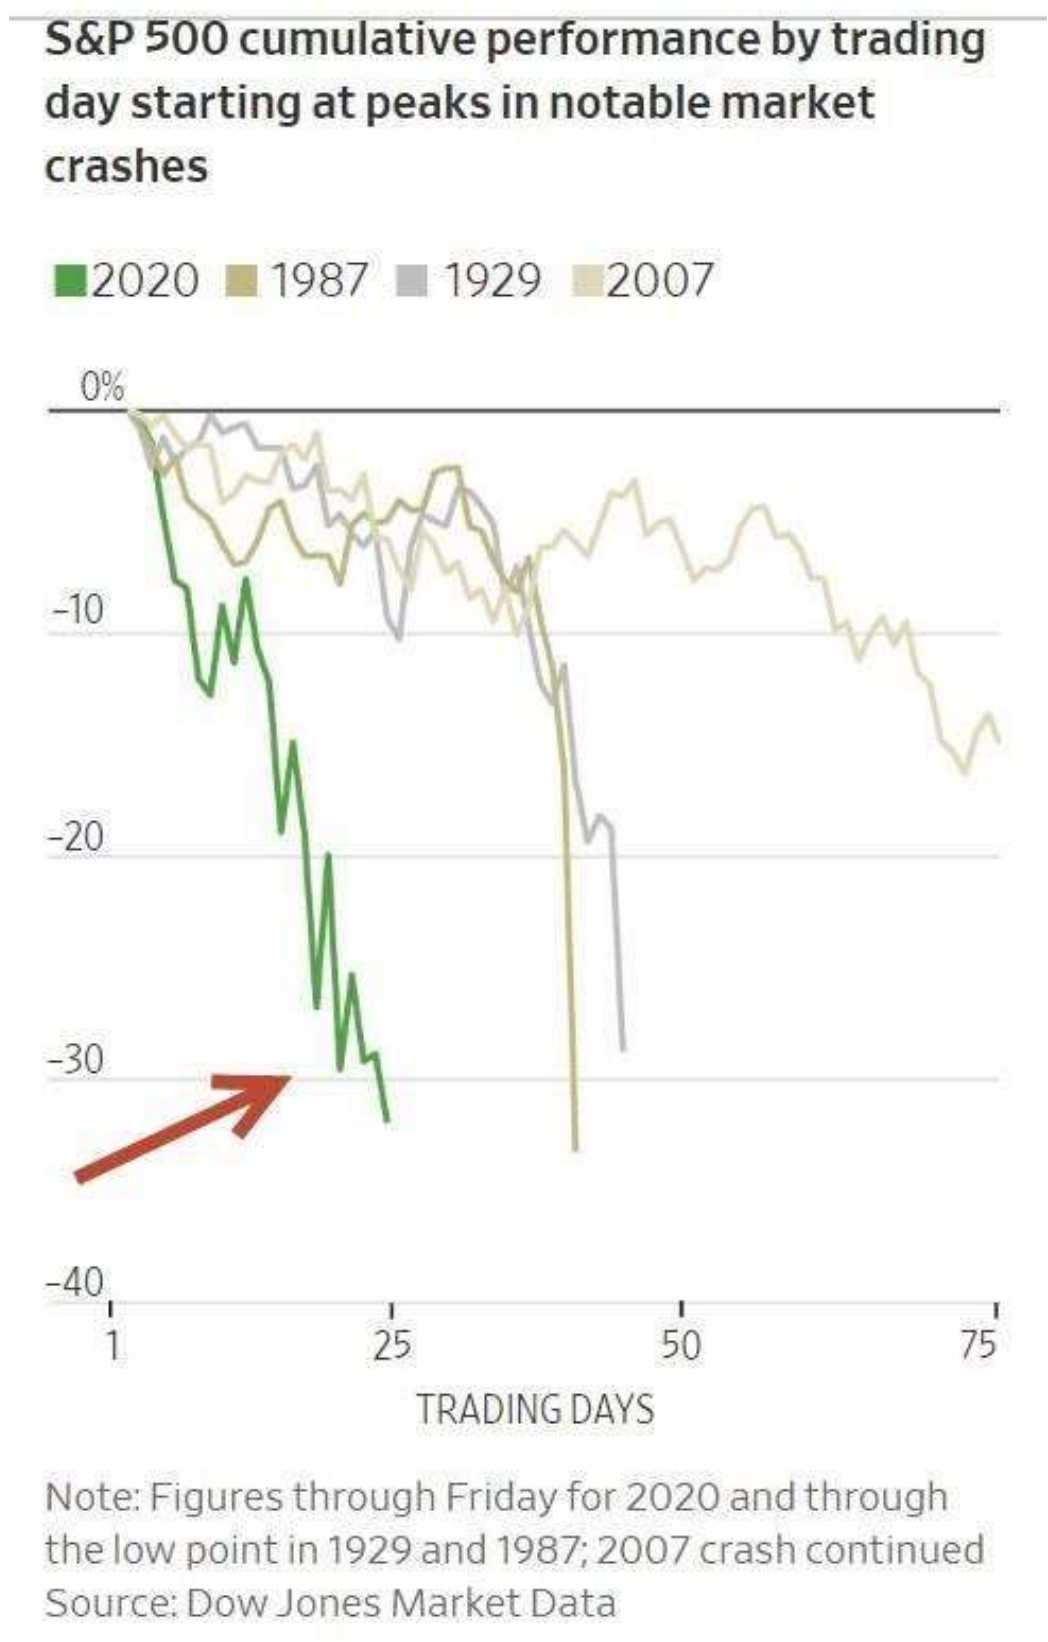
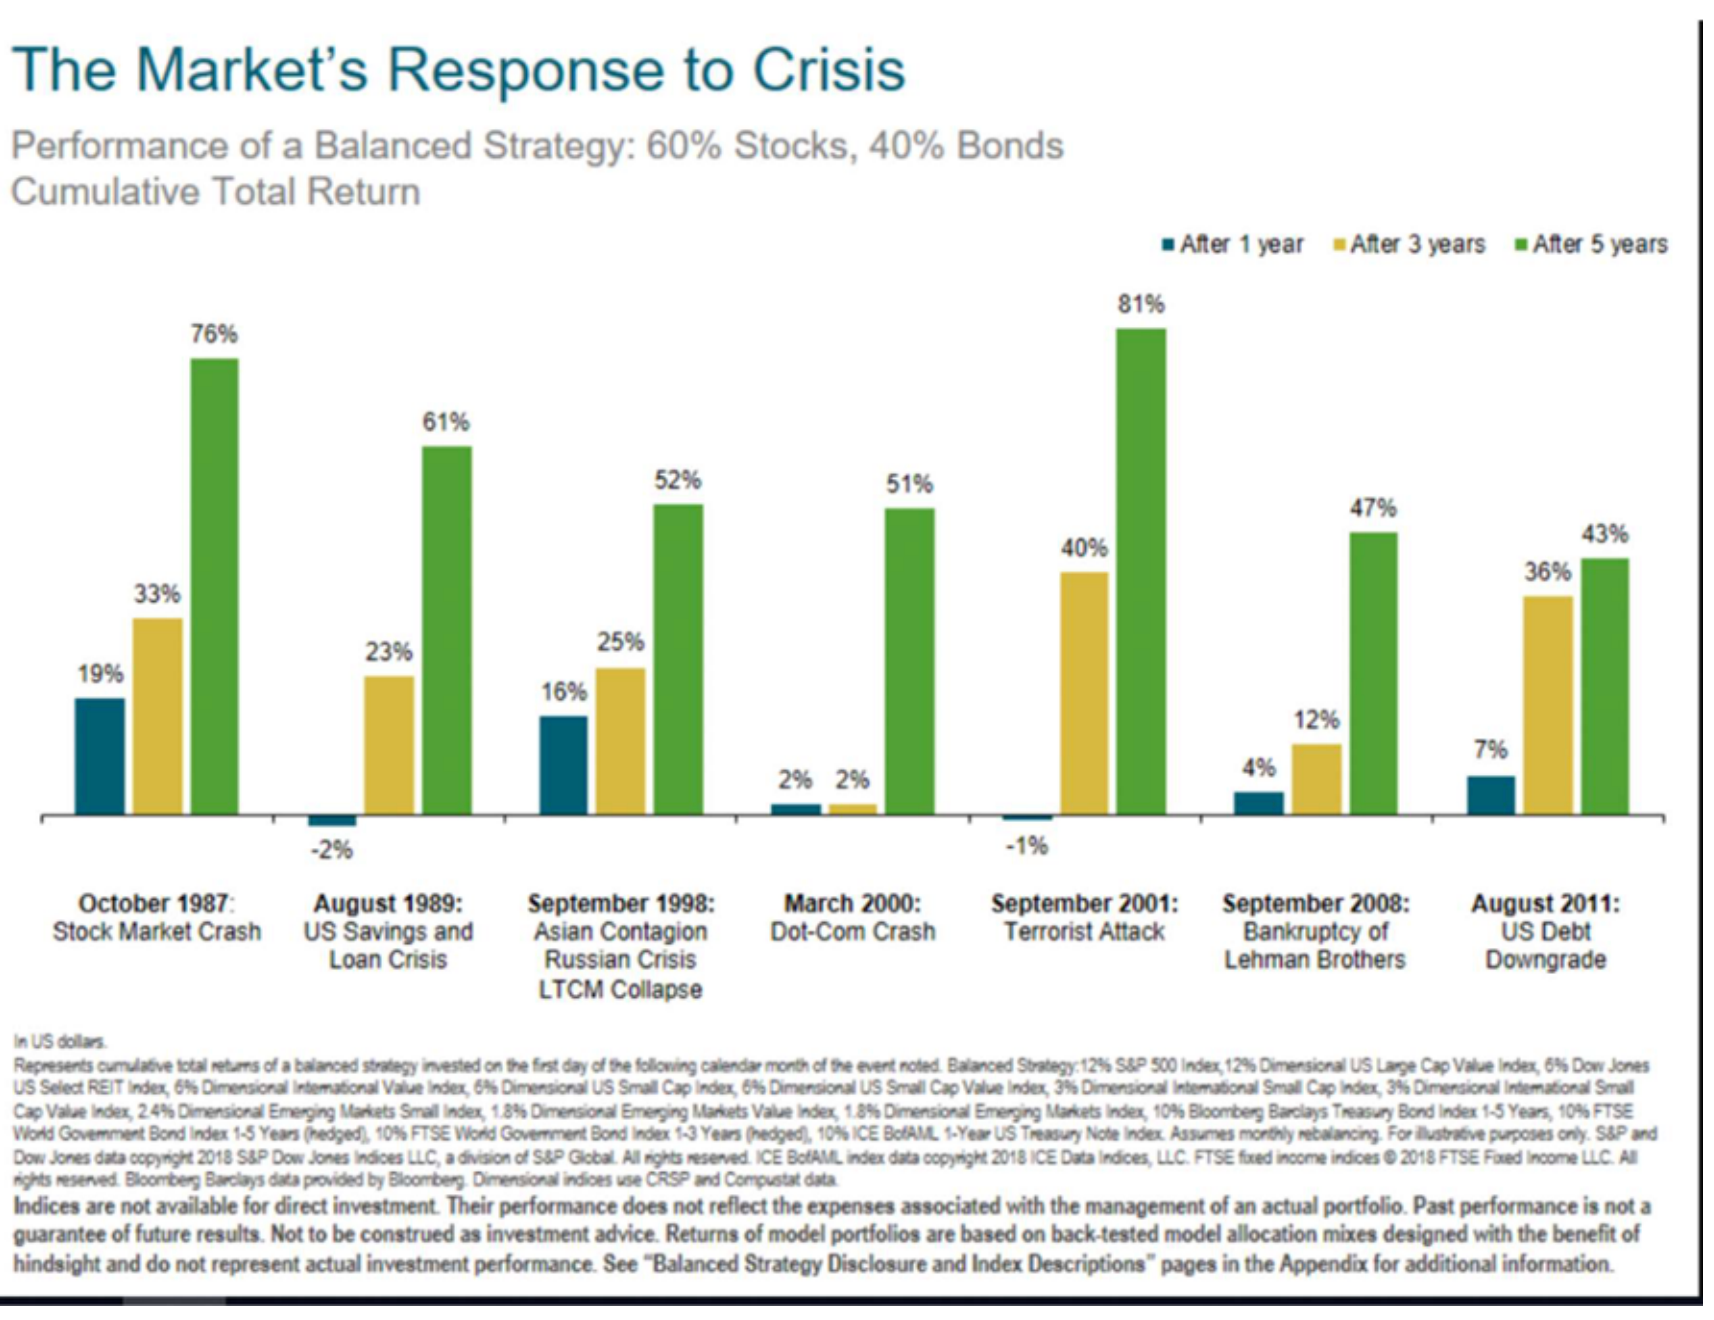
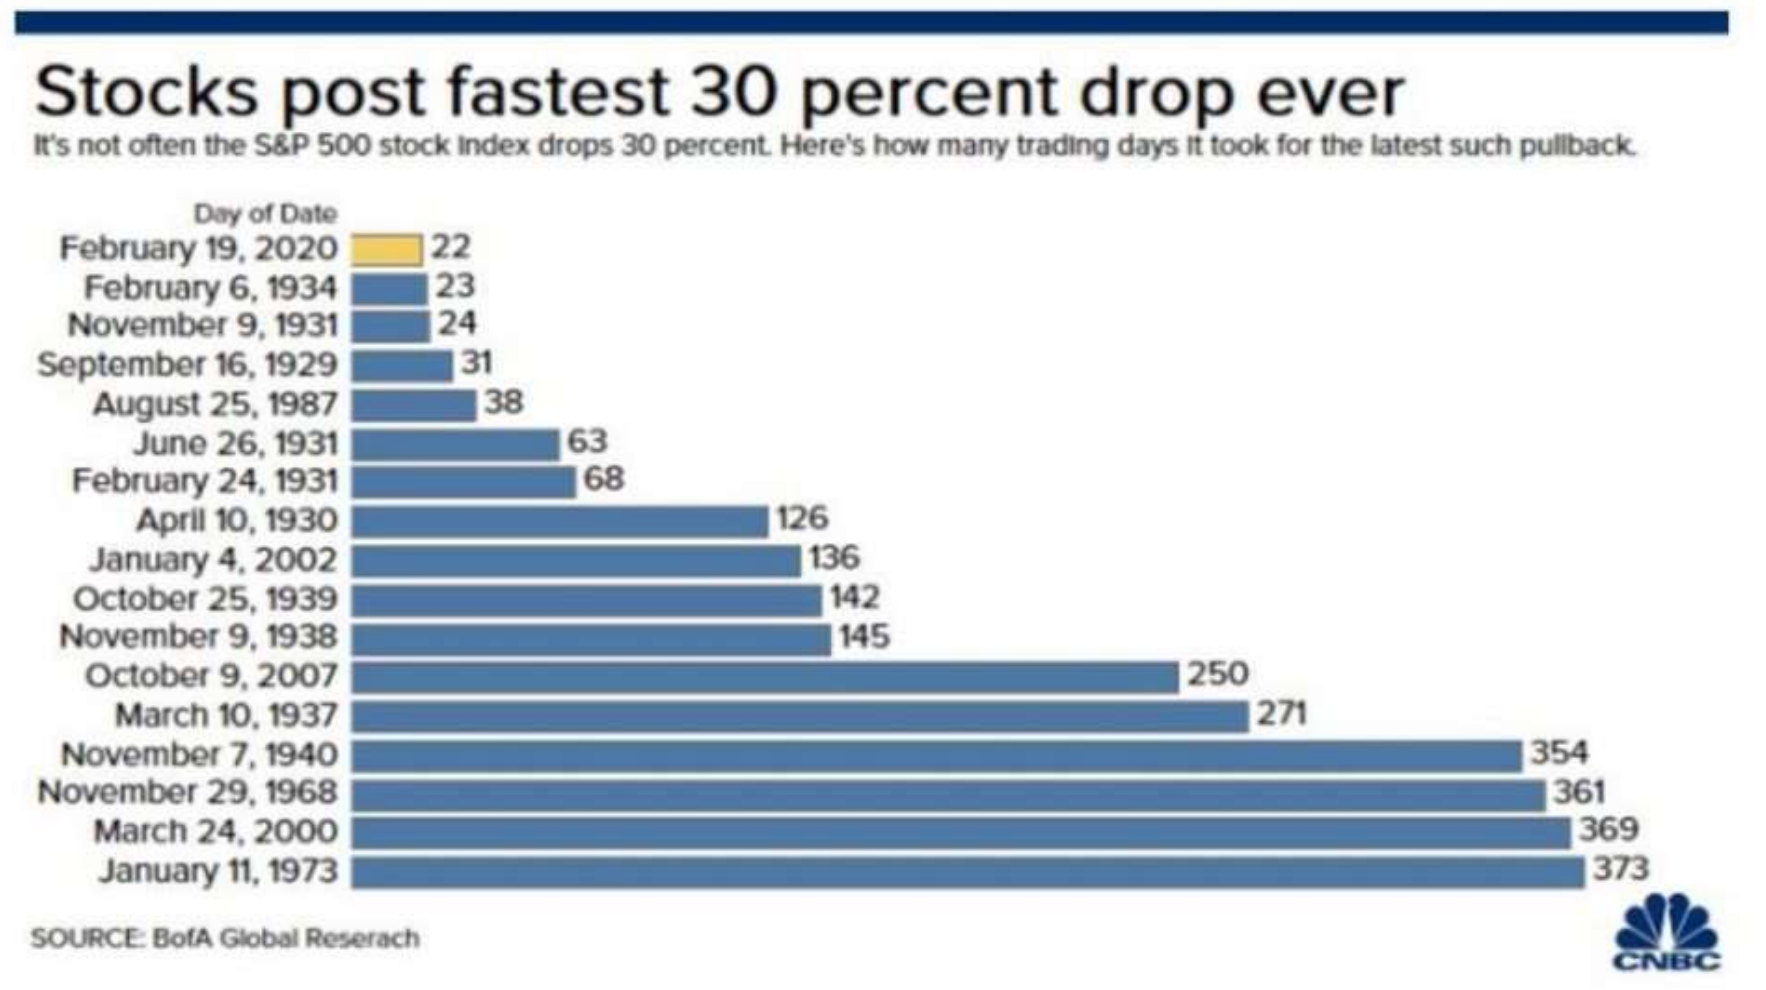
Meanwhile, the stock market saw the fastest 30 percent drop in history. In fact, it was only the fourth time in 75 years that a conservative 60/40 portfolio was down 20 percent. Not only that, but the stock market volatility index (aka the VIX) reached a high of 82.69, breaking the previous record set in 2008.
Money talks
But it doesn’t sing and dance and it don’t walk
And long as I can have you here with me
I’d much rather be forever in blue jeans
Honey’s sweet
But it isn’t nothing’ next to baby’s treat
And if you’d pardon me, I’d like to say
We’d do okay forever in blue jeans
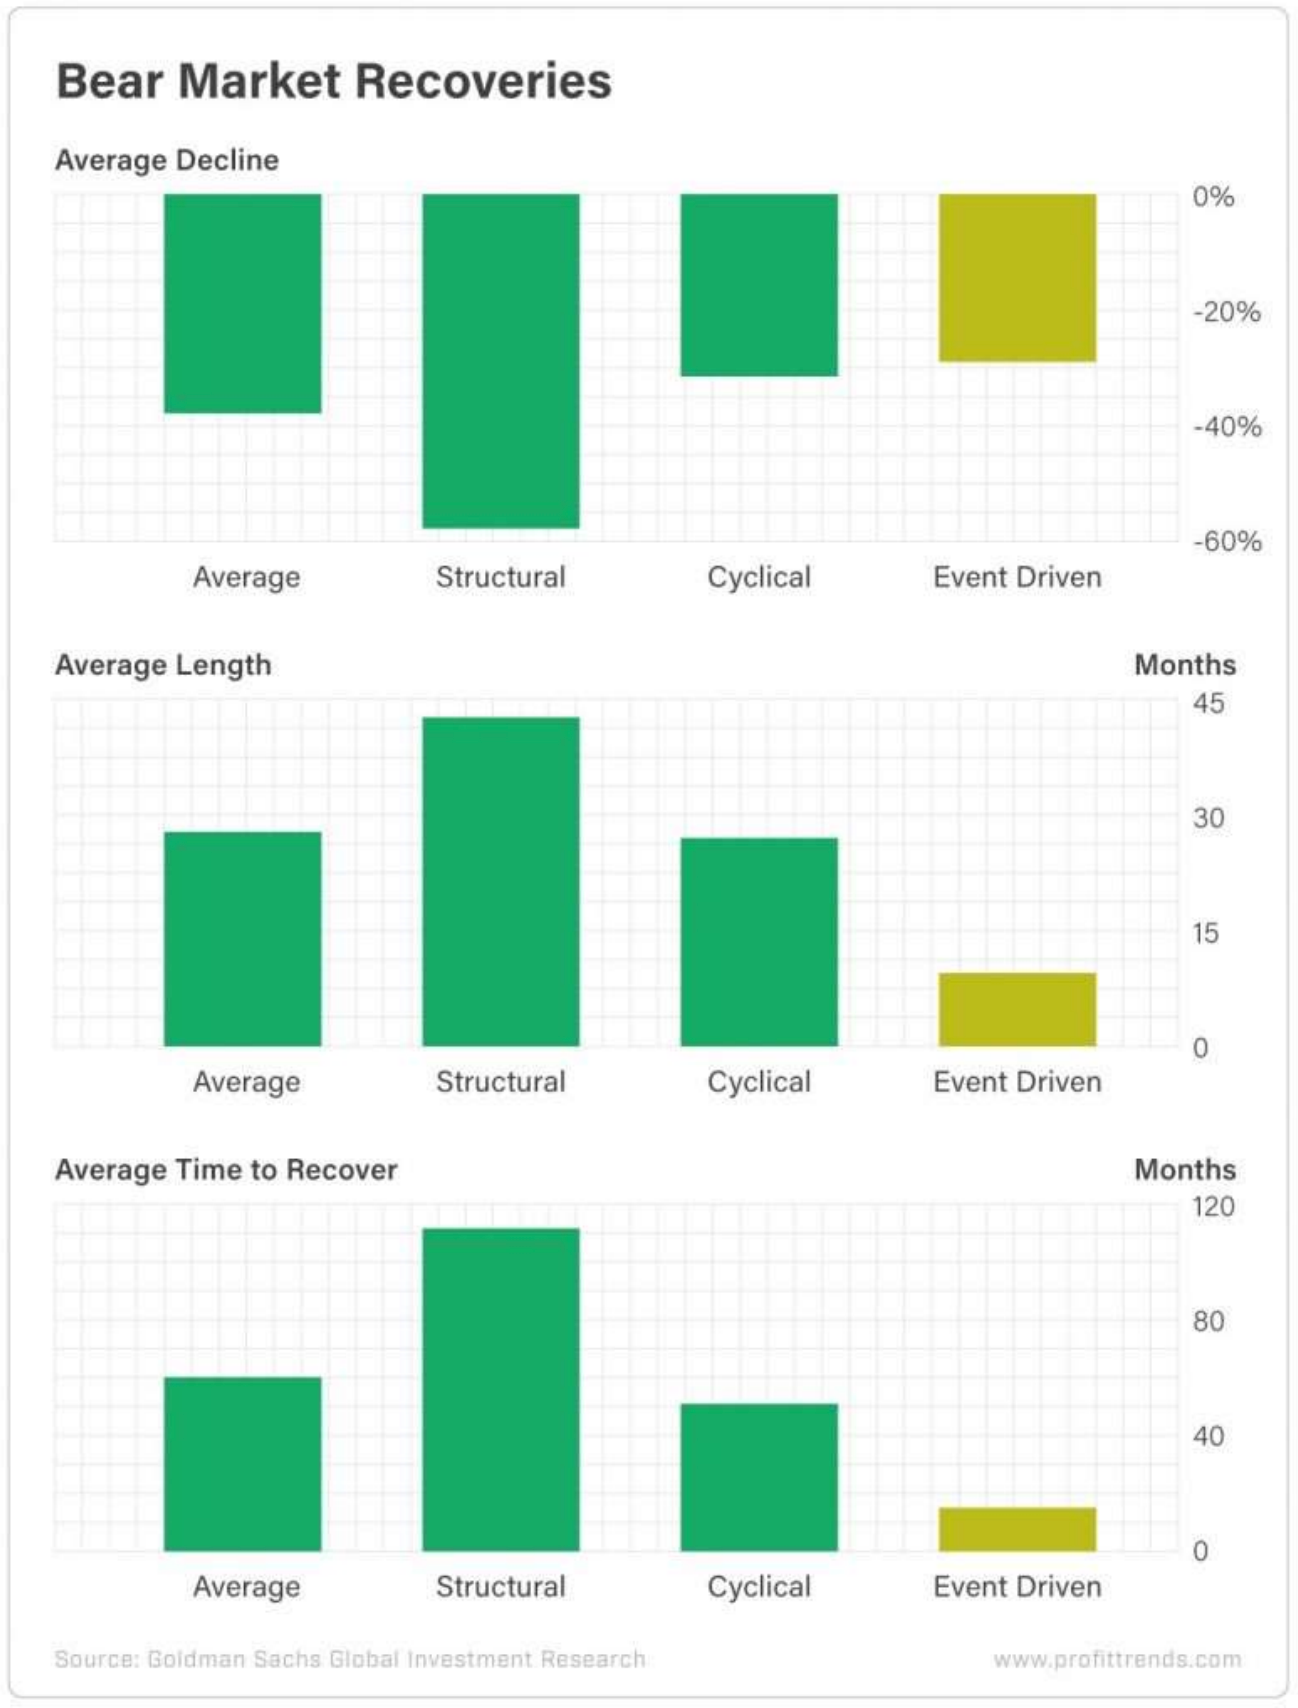
Economists believe there are three types of bear markets:
1. Structural bear markets.
2. Cyclical bear markets.
3. Event-driven bear markets.
Each has a different average decline, duration and time to recover.
According to Investment U. columnist, Matthew Carr, we’re currently in an event-driven bear market which was “triggered by an exogenous shock” (i.e. pandemic) rather than a more serious structural or cyclical bear market. Carr likens the current bear market to other event-driven downturns such as what occurred during the 1973 oil crisis, or earlier World Wars.
Carr believes event-driven bear markets are the easiest breed of bear to “tame” and we tend to recover much faster from event-driven bear markets than from structural and cyclical bear markets. In fact, the six bear markets we’ve endured since 1960 have lasted an average of 418 days (about 13.75 months) according to Goldman Sachs Global Investment Research. This signals “a considerably shorter uphill climb than what we’ve seen with structural or cyclical declines,” noted Carr.
Bear markets can last for multiple years or just several weeks. A secular bear market can last anywhere from 10 to 20 years and is characterized by below average returns on a sustained basis. There may be rallies within secular bear markets where stocks or indexes rally for a period, but the gains are not sustained, and prices revert to lower levels.
A cyclical bear market, on the other hand, can last anywhere from a few weeks to several months.
These probabilistic return assumptions depend on current market conditions and, as such, may change over time.
IMPORTANT: The projections and other information generated by the Vanguard Capital Markets Model regarding the likelihood of various investment outcomes are hypothetical in nature, do not reflect actual investment results, and are not guarantees of future results. Distribution of return outcomes from the VCMM are derived from 10,000 simulations for each modeled asset class. Simulations are as of March 31, 2019. Results from the model may vary with each use and over time.
I certainly did not predict the current volatility triggered by the coronavirus of 2020. As I mentioned in my white paper (Investing Is a Psychology Game Not an IQ Game), most predictions about the market and economy prove false. Most of the bold predictions end up being nothing more than adult storytelling. Instead of looking for a crystal ball, you can do your research and work through some math probabilities and shift investments to your favor.
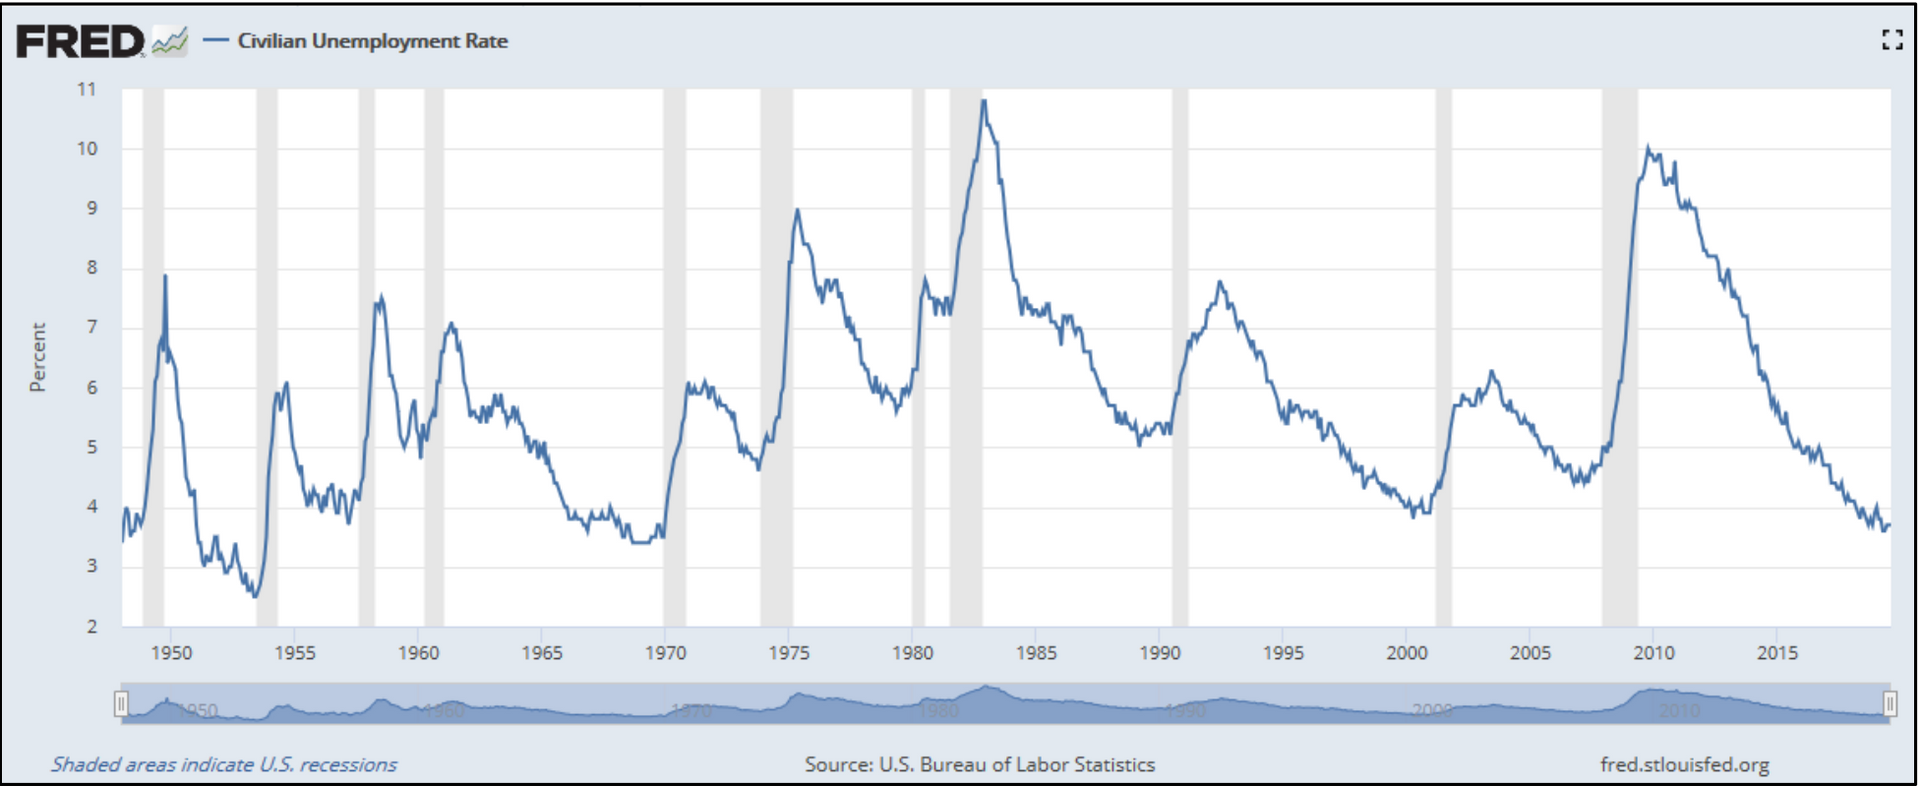
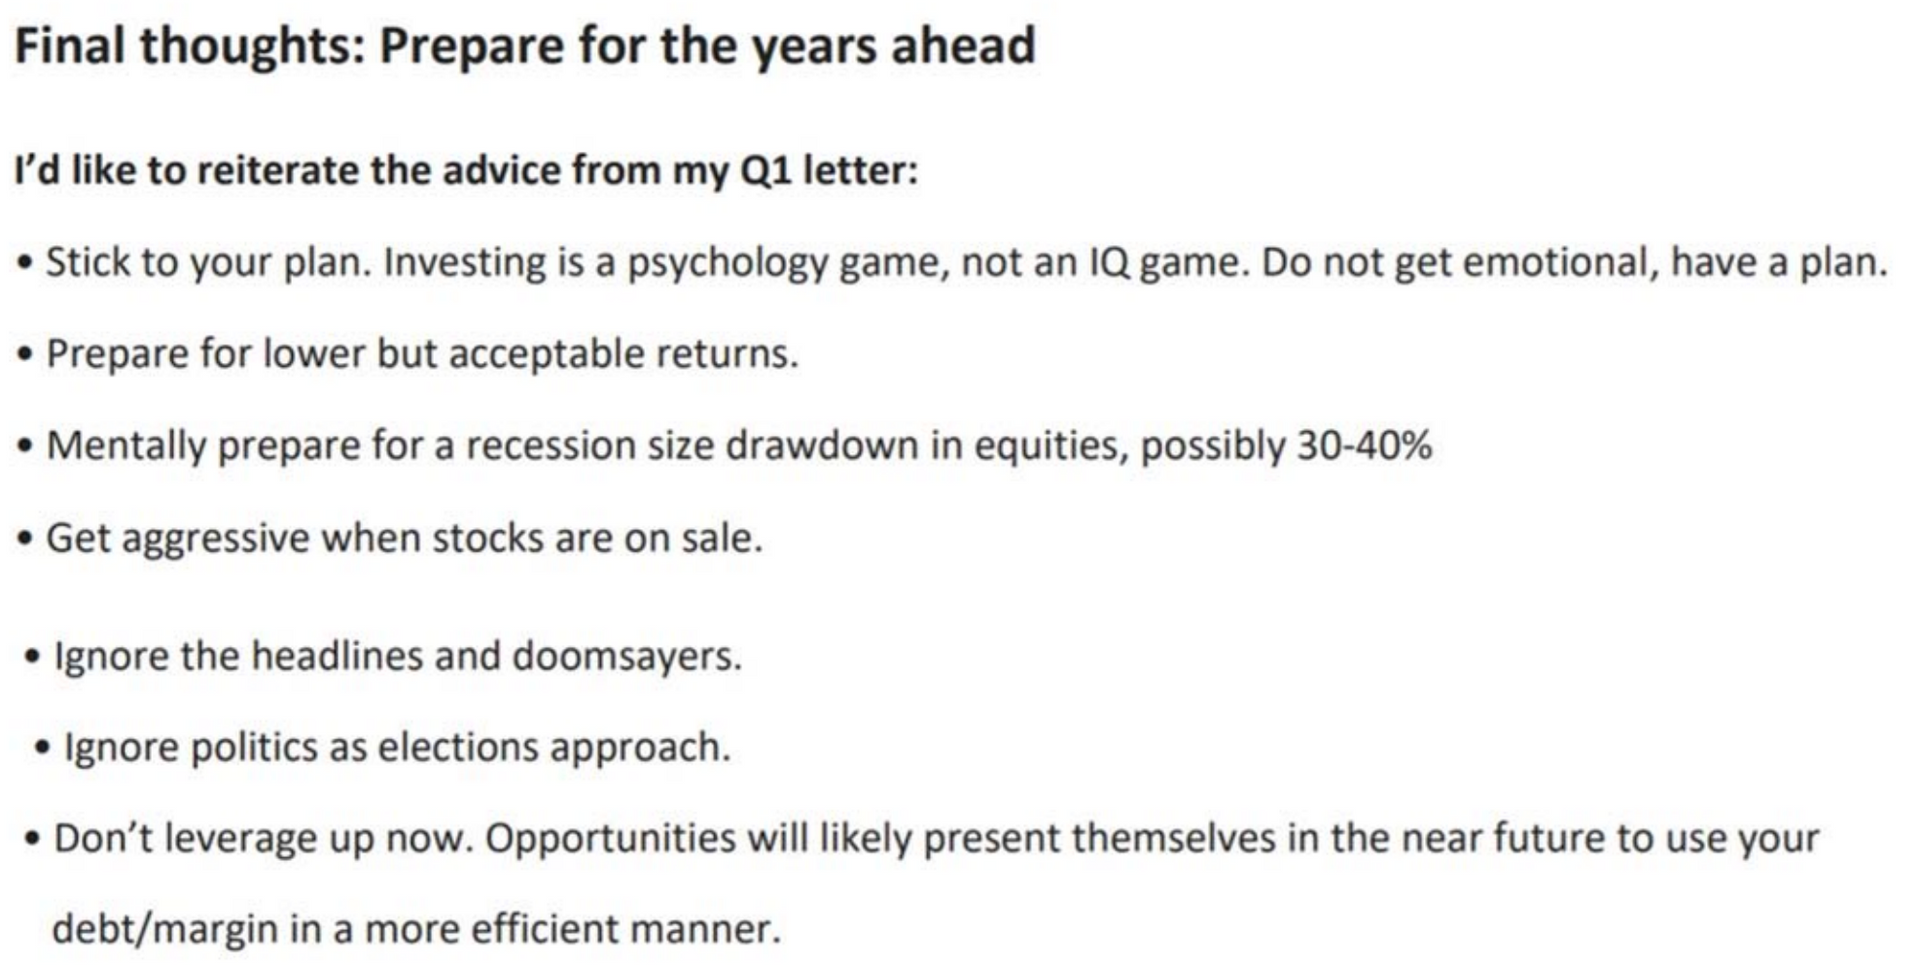
Some of you may remember how I concluded my Q1 and Q2 Letters of 2019: “Prepare for lower, but acceptable returns over the next five years; mentally prepare for a recession-size drawdown in equities—possibly 30 to 40 percent—and don’t leverage up now.” These recommendations were not predictions; they were based on the calculus behind stock market valuations and other relevant economic indicators, such as the forward returns we tend to see when unemployment dips below 5 percent. At the time, I also recommended being aggressive about buying stocks when prices are down, depending on your age and goals. This is a good idea today as valuations are reverting to levels below their historical mean. Today’s market may be a great chance to buy great stocks at a discount. Volatility will likely continue, but stocks always have proven to be long-term money makers when purchased at reasonable prices.
Below are my conclusions from 2019 letters which remain relevant today:
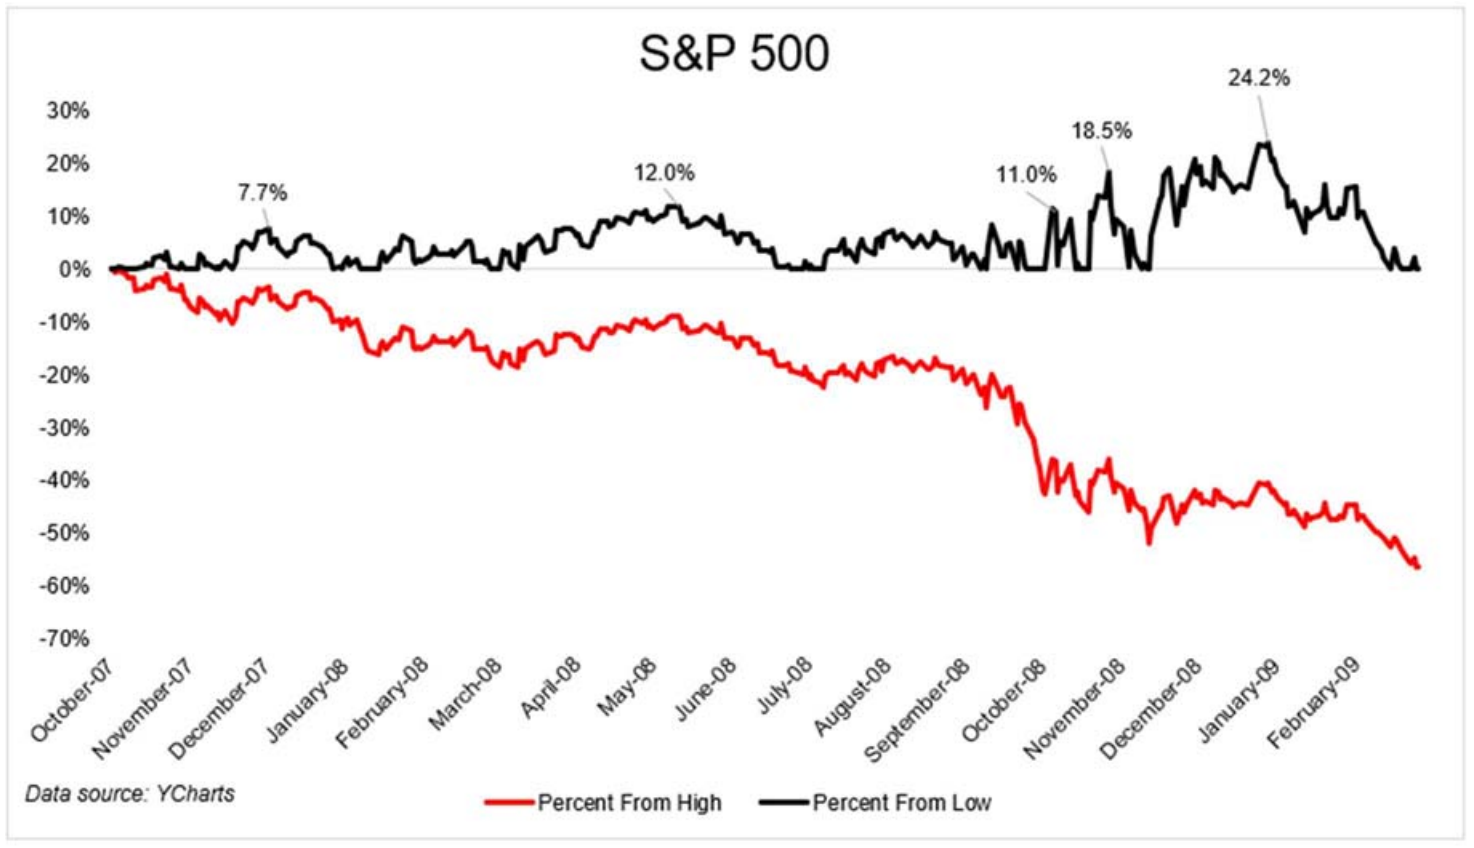
2008 bear
We saw something similar in 2008, noted Batnick. As the declines got steeper post Lehman, so did the bear market rallies.
Keep in mind that we are in a bear market
Bear markets are not straight down affairs. In fact, the biggest and most violent market rallies tend to happen during stock market downturns. Bear markets generally take months, even a full year, to bottom out—not days or weeks like we saw during the March 2020 rally. As mentioned earlier, I am very bullish on American resilience, but people will not be running out to purchase cars or do extensive home improvements immediately after the pandemic ends.
Continue to follow my advice from past quarterly letters and “avoid doomsayers.” It’s a good idea to limit your consumption of cable news to one hour a day. During a crisis like this, listen to fact-based scientists and doctors such as those from John Hopkins for updates. Don’t be swayed by politicians or the news media. At a minimum, this is going to be our nation’s toughest test since 2008 and quite possibly, the harshest economic blow that most of us have seen in our lifetimes. Michael Batnick, Director of Research at Ritholtz Wealth, does a fabulous job of summarizing the bear market rallies we need to get ready for coronavirus-driven shutdowns of entire countries.
According to Batnick, eight of the ten best days the market has seen since 1950 have occurred during bear markets. Here is a summary of the bear market rallies during the dot.com bust of 2000 and the Great Recession of 2008. As you can see in Batnick’s charts below, rallies of 20 percent or more often happen during bear markets.
On December 7th, 1999, Barron’s published the infamous “What’s Wrong,Warren” cover eerily before the Nasdaq crashed 50% and Berkshire recovered years’ worth of underperformance.
The below graph plots the time period 6/30/98 through 2/29/00 for the Nasdaq where many dot-com and technology stocks traded, and the price of Berkshire Hathaway, Warren Buffett’s holding company, which consisted of value stocks:
Conclusion
THIS MUCH IS CLEAR TO ME; AS THE COUNTRY ENTERS LOCK DOWN FOR ANOTHER MONTH, WE ARE FACING AMERICA’S MOST UNCERTAIN PERIOD SINCE WWII. JUST REMEMBER THAT THE MARKET PRICES IN UNCERTAINTY BEFORE THE WORST OF THAT UNCERTAINTY OCCURS. AMERICA’S ECONOMIC RESPONSE TO PAST CRISES HAS BEEN INCREDIBLY RESILIENT.
DURING 9/11, IT WAS A TERRORIST THREAT THAT NEEDED TO BE HANDLED BY OUR MILITARY AND INTELLIGENCE ORGANIZATIONS. TODAY, OUR ENEMY IS A VIRUS THAT WILL EVENTUALLY BE DEFEATED BY OUR SCIENTISTS AND HEALTHCARE PROFESSIONALS. I AM WILLING TO BET BIG ON OUR SCIENTISTS, DOCTORS AND EMT WORKERS TO LEAD US OUT OF THIS PREDICAMENT.
AGAIN, OUR FIRST PRIORITY IS THE HEALTH AND WELFARE OF OUR FELLOW CITIZENS. BUT THE ECONOMY WILL REBOUND EVENTUALLY BECAUSE QUITE SIMPLY…IT ALWAYS DOES…THE U.S. WILL BE BACK TO WORK SOON SO FORGET ABOUT BEING FOREVER IN BLUE JEANS.
Source
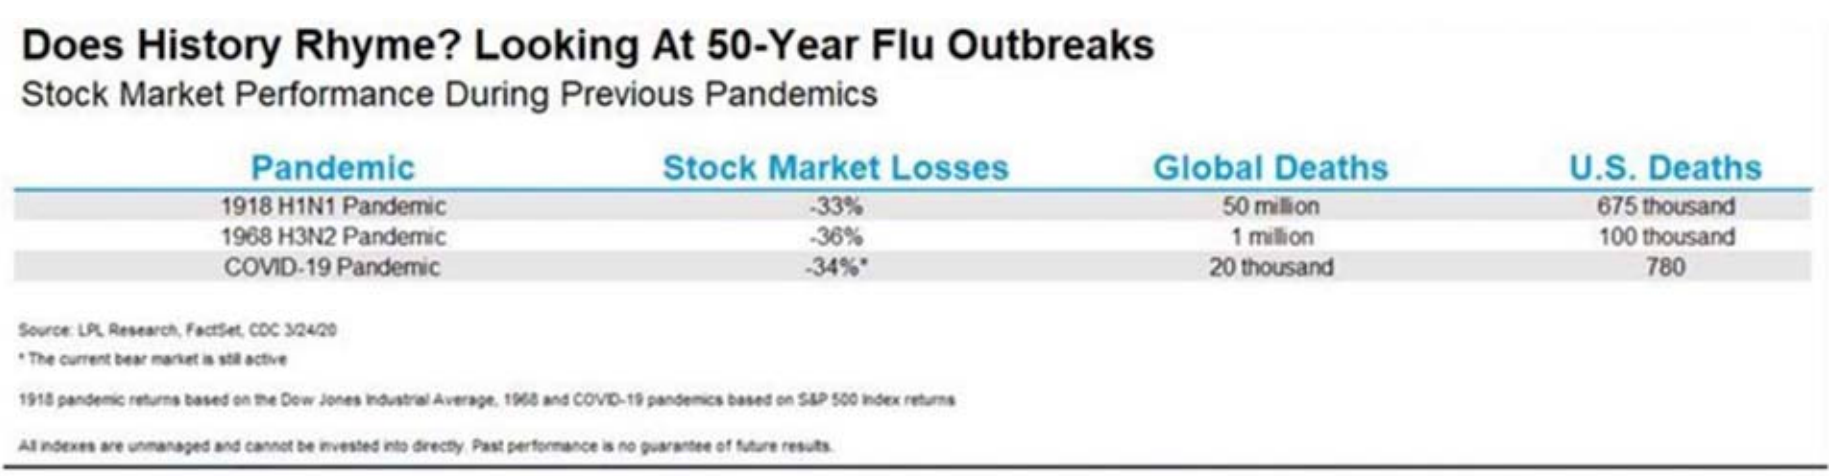
A remarkable chart from LPL research (see below), shows how similar the 2020 pandemic-driven crash was to the crashes of 1918 and 1968 which were also triggered by global virus outbreaks. Although our response to COVID-19 has been imperfect, we want to focus on our citizens health first and foremost, before we start worrying about the market and economy rebounding. However, history shows that the stock market proves resilient coming out of crisis situations time and time again. That’s because It’s tough to keep Americans away from their favorite pastime—hard work—for long.
Where does this leave us going forward?
My Q4 letter of 2019 focused on the retirement dilemma facing U.S. senior citizens. One drawback to living longer during a time of high stock market valuations, low bond yields and record high private company valuations is that you have a much longer retirement “runway” to fund. As a result, retirees and near-retirees have lower expected returns going forward just as they are expected to live longer healthier lives.
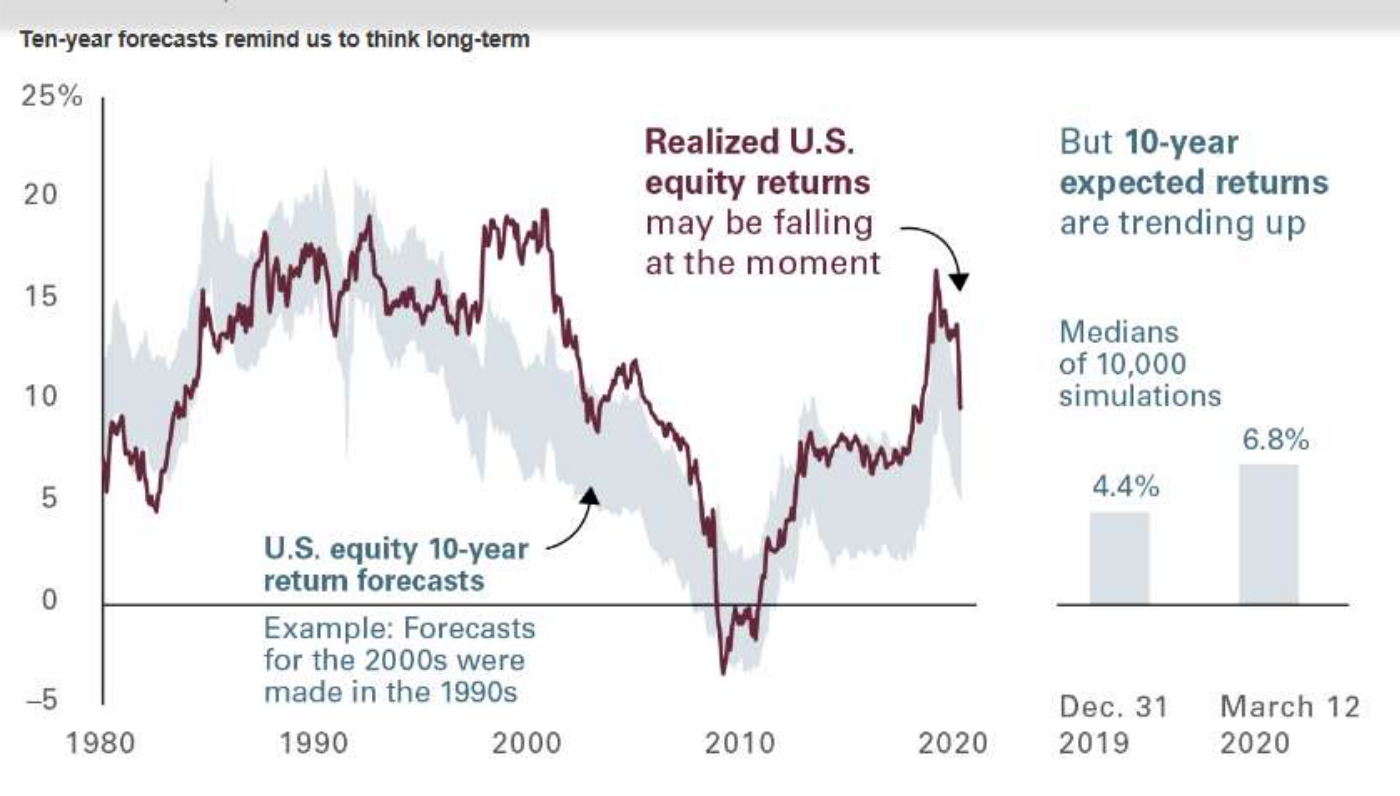
According to Vanguard data, March’s gut-wrenching stock market correction has shifted its 10-year projected returns for U.S. stocks to 6.8 percent, from 4.4 percent. Stock market fundamental valuations have come down dramatically in this sell-off so 10-year returns from these levels are higher.
It would make sense for young adults to go “all in” on stocks at these market levels. Short-term pain may continue, but long-term wealth is built during high volatility down markets like we have now.
A record month for records
Consider this: During one two-week stretch in March, the Dow Jones Industrial Average experienced its best single day since 1933 as well as its two worst days since the Black Monday crash of 1987.
According to Dorsey Wright research, the Dow registered 10 separate days in March 2020 that ranked among the largest single-day moves since 1985. The Dow had five of its 20 best single-day returns in March 2020 as well as five of its 20 worst single-day returns. To put these extremes into perspective, we have seen only two days since 2009 that ranked in the 20 best or 20 worst days since 1985 – December 26, 2018 when the Dow gained 4.98% and August 8, 2011 when the index lost 5.55%. No other month since 1985 has had nearly as many eye-popping single-day moves as March 2020 did.
I know it’s hard to fathom, but in March, we surpassed the crashes of 1929 and 1987 with the fastest 30 percent correction ever. Even during the Internet bubble of 2000, it took over 250 days for the market to lose 20 percent—it took just 22 days during the March madness of 2020.
Black Swan
It’s safe to say the coronavirus pandemic was a stock market “Black Swan” event—a complete statistical outlier—that caught everyone off guard with the possible exception of some U.S. Senators who were able to cash out their positions right before the crisis was officially announced by the President. The term Black Swan—popularized by Nassim Nicholas Taleb’s book “The Black Swan: The Impact of the Highly Improbable”—is an event or occurrence that deviates beyond what is normally expected of a situation and that would be extremely difficult to predict. Some prognosticators claim they predicted the recent market crash, but as Taleb states in his book, “humans are great machines at looking backwards, we are experts in self-delusion.”
The pandemic-led market crash of March was a painful 30-percent hit, no doubt. But history shows the odds remain very strong that investors who stick to their discipline will be generously rewarded for their patience in the 12 to 36 months post-crash.
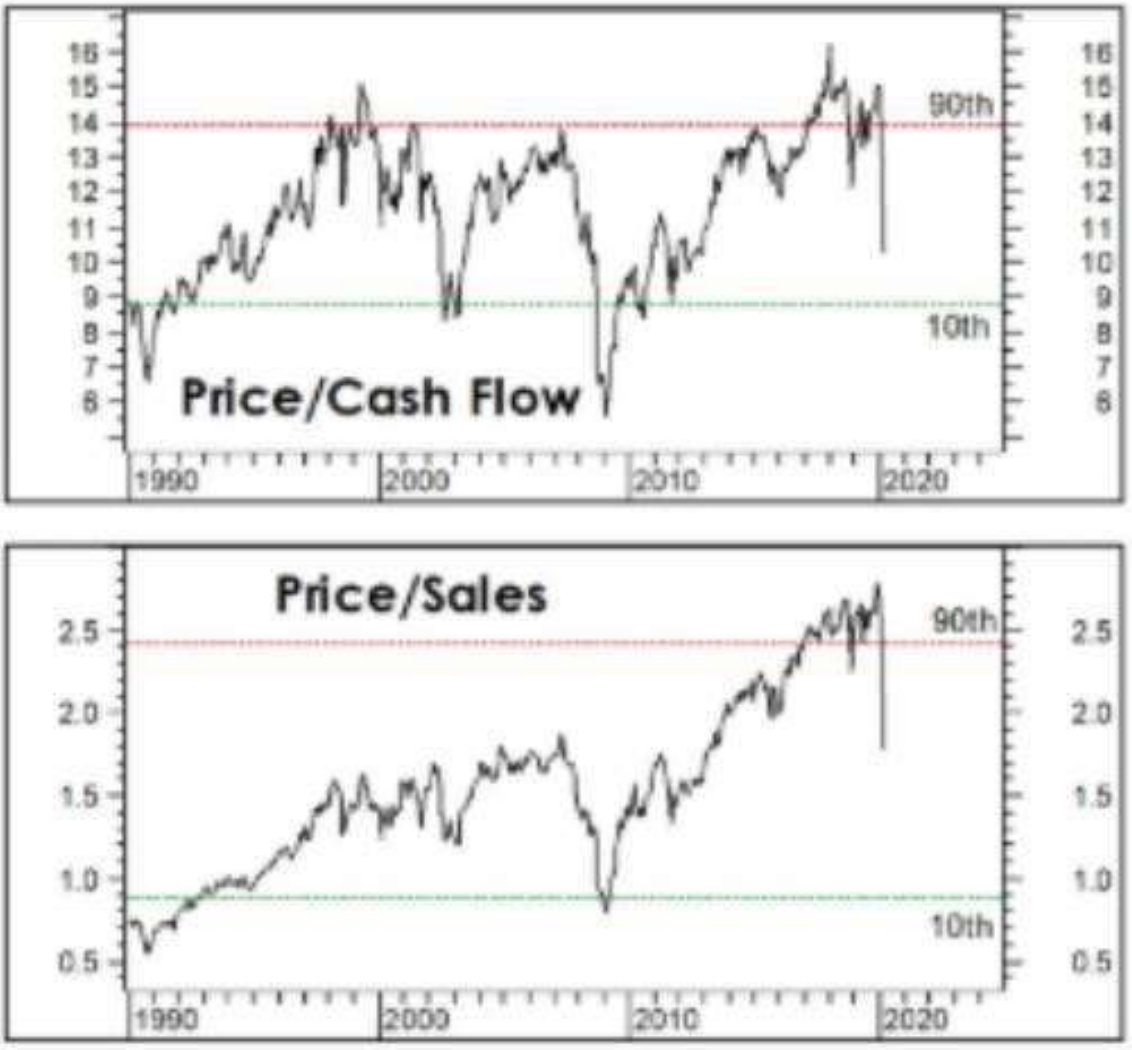
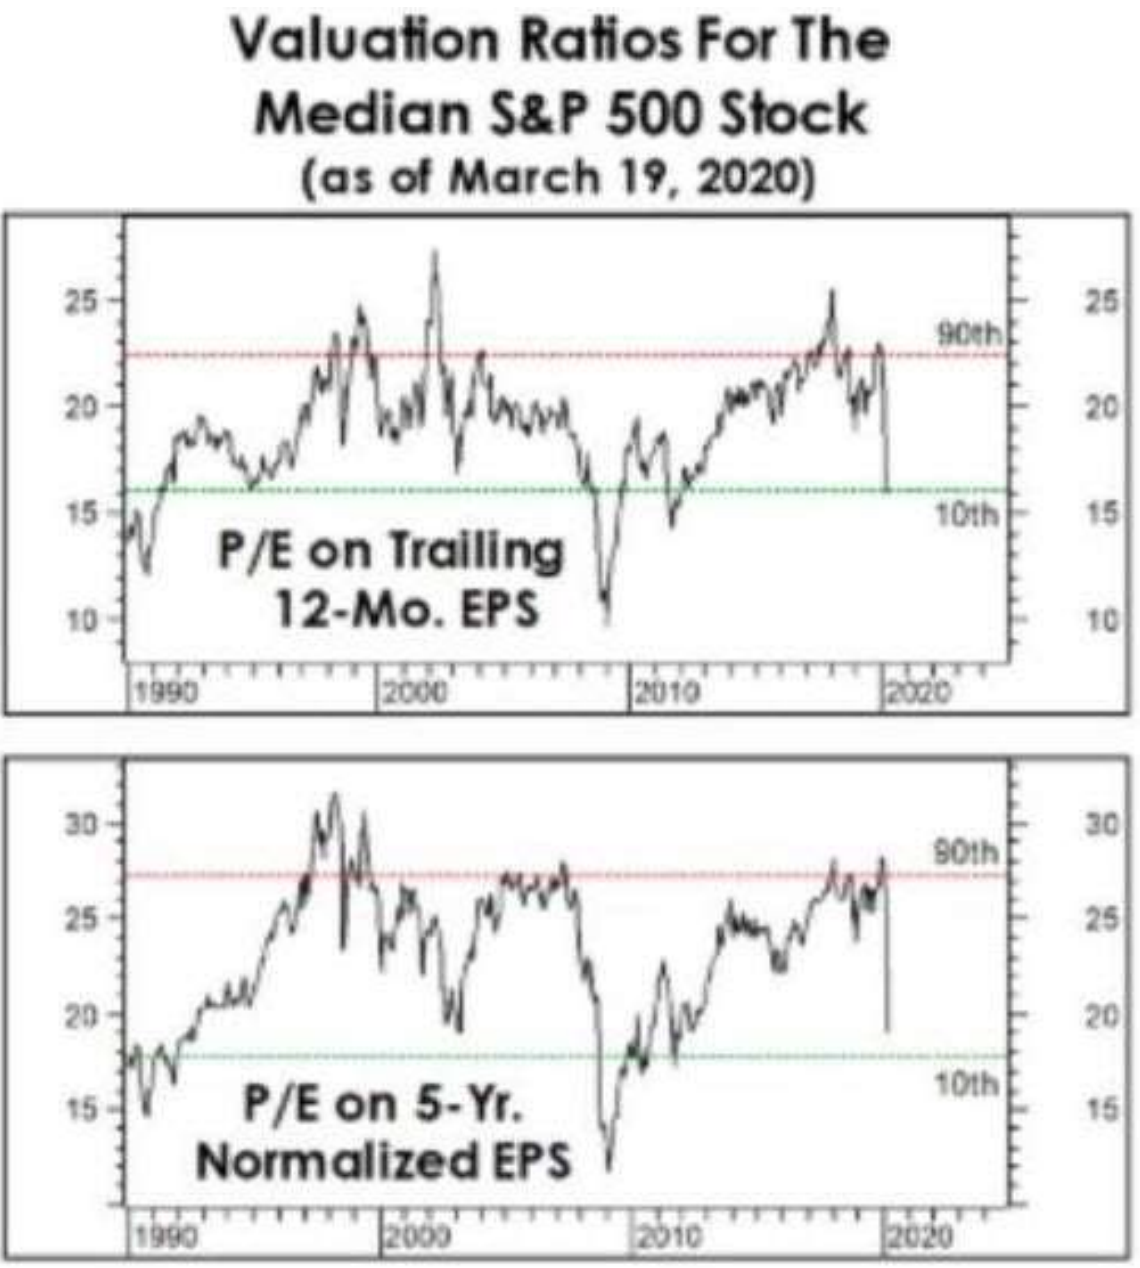
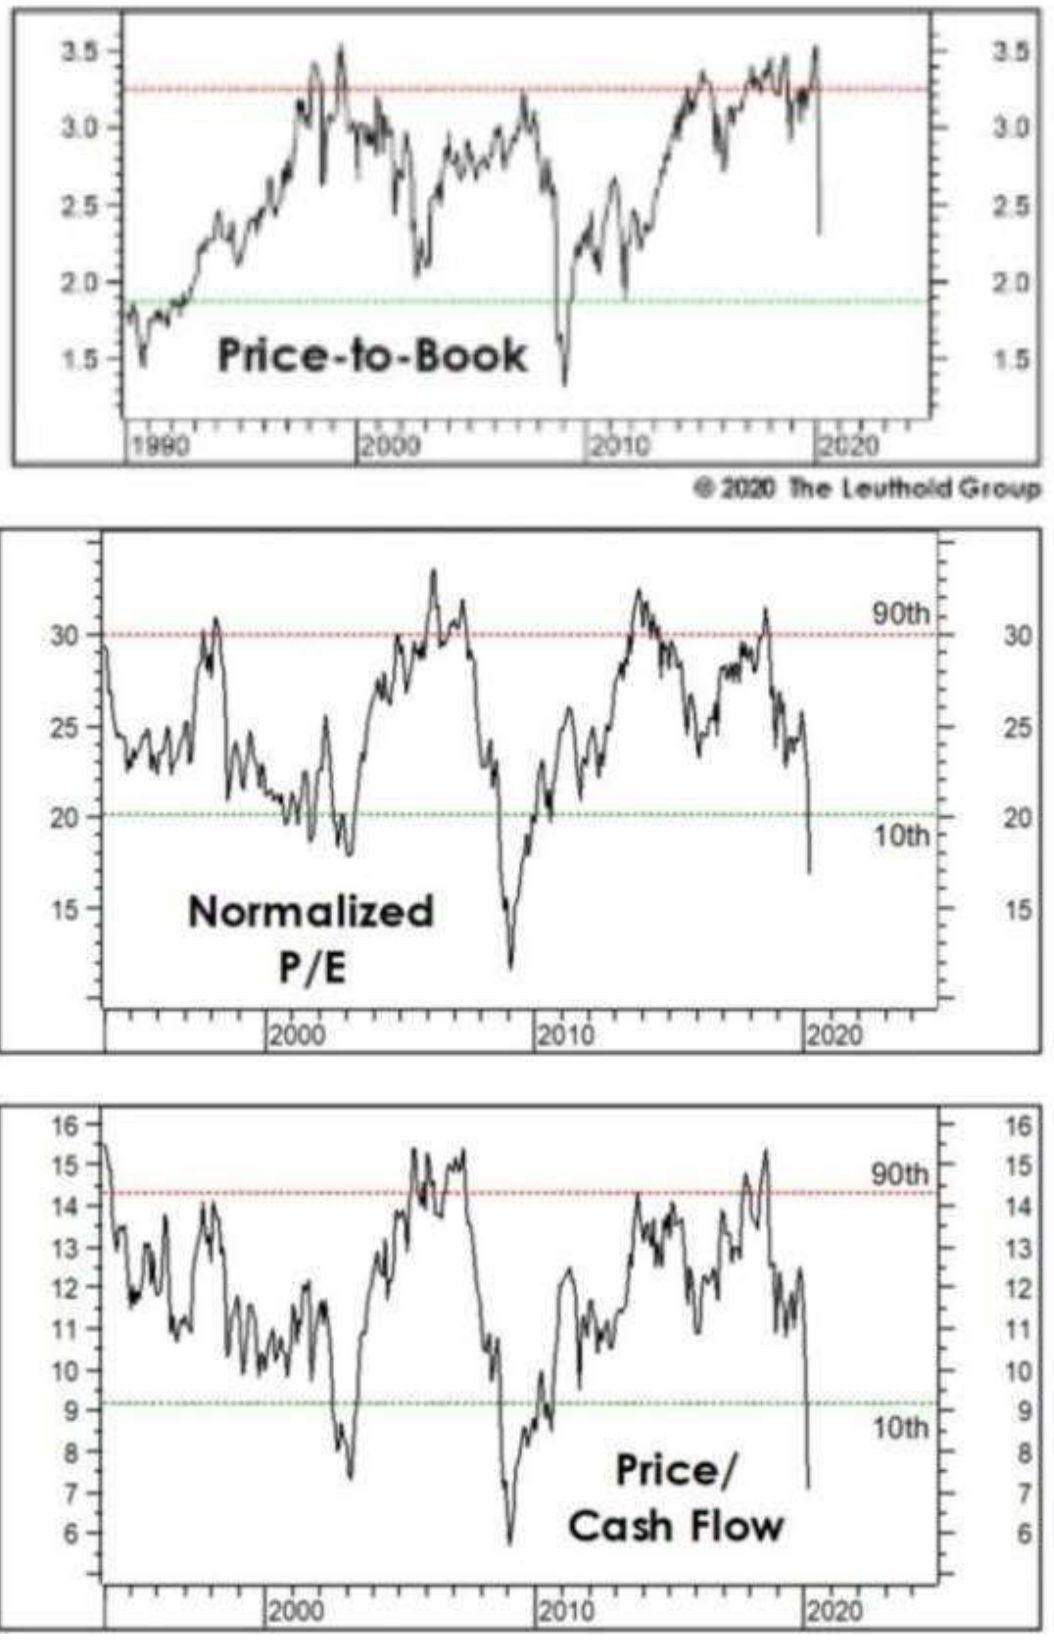
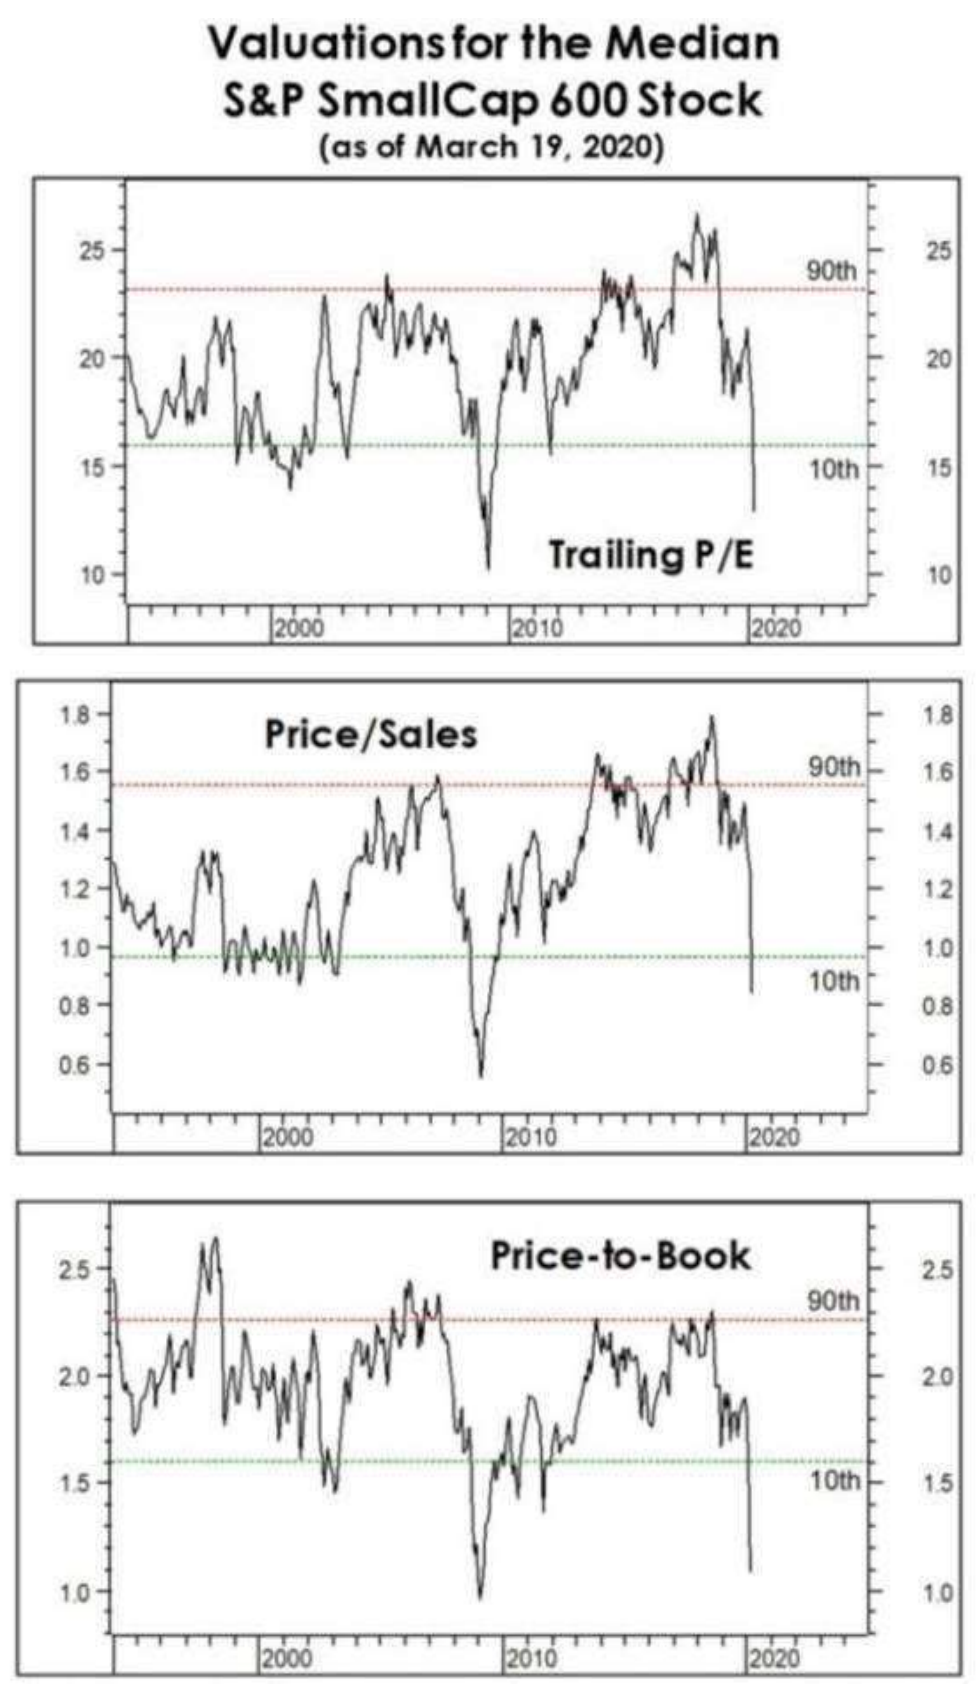
One of the good things about bear markets is that they make stocks cheaper. As Warren Buffett always says: “Stocks are the only things that people never buy when they go on sale.” For instance, large cap U.S. stocks are seeing their valuations fall back to their historical means, while valuations of small cap U.S. stocks have fallen all the way back to 2008 levels. There is no need to get deep in the weeds about valuation methods. Just know that higher percentile rankings mean more expensive and lower percentile rankings mean cheap. Meb Farber, co-founder and Chief Investment Officer of Cambria Investment Management, did an excellent analysis below about whether or not stocks are expensive (or cheap) from a historical perspective.
Stock market valuations
As you can see from the charts above, stock prices have very quickly gone from very expensive to cheap, with the possible exception of Price-to-Sales. The market should continue to be volatile for the months to come so it would not be surprising for stocks to get even cheaper.
I have more good news to share with you beyond the world of valuations. Stock markets tend to bounce back faster from event-driven bear markets (like we have today) than from cyclical or structural bear markets. In my previous quarterly letters, I wrote that I expected the next U.S. recession to be a cyclical one accompanied by a longer structural bull market. Instead, the pandemic has caused an event-driven recession. If there’s a silver lining here, it’s that recent actions taken by Congress and the Fed should go a long way toward preventing the U.S. from slipping into a longer and more painful “structural” bear market. Did the government do enough to hold off a structural bear? This is the question that is still open as you will see at the end of this letter, we have debt issues that could spiral downward if we don’t check the virus impact in a short time frame.
3 types of bear markets: -Structural, cyclical and event-driven
Notes: Forecasts correspond to the 25th to 75th percentile of distributions of 10,000 Vanguard Capital Markets Model simulations for ten-year annualized nominal returns, in U.S. dollars, based on the MSCI US Broad Market Index. IMPORTANT: The projections and other information generated by the VCMM regarding the likelihood of various investment outcomes are hypothetical in nature, do not reflect actual investment results, and are not guarantees of future results. Distribution of return outcomes from VCMM are derived from 10,000 simulations for each modeled asset class. Simulations are as of December 31, 2019, and March 12, 2020. Results from the model may vary with each use and over time. For more information, please see the important information below.
Source: Vanguard.
A sharp (and we hope short) contraction
Recessions and deficits
It’s safe to say that we are in a recession, but the U.S. has never entered a recession with interest rates this low and a deficit so high. The U.S. deficit was already at crisis levels before the pandemic struck and real (inflation-adjusted) interest rates were already negative. When analyzing deficits, it’s important to consider their size relative to the U.S. gross domestic product (GDP). Although the Government’s recent stimulus package explodes the deficit, we have had significantly higher deficits relative to GDP before—especially during war time.
Wells Fargo economist, Michael Pugliese, put the deficit in perspective very elegantly in a recent Barron’s summary below:
March 18: Just how big could fiscal stimulus get? During the Great Recession, the federal budget deficit peaked around 10% of gross domestic product. Were the federal government to run a similar deficit this year, it would amount to about $2.2 trillion.
But even this 10% figure probably does not represent the true upper bound on federal borrowing. During World War II, the federal budget deficit peaked at nearly 30% of GDP in 1943, and was more than 20% each year in the 1943–45 period.
A federal budget deficit of 30% of GDP today would amount to nearly $7 trillion. Of course, financing these deficits required extraordinary efforts, such as sizable war-bond programs and direct coordination between the Treasury and the Federal Reserve. While we doubt the fiscal response will be anything quite that big, the federal government possesses significant fiscal ammunition, particularly when real interest rates on Treasury securities remain negative.
What could go wrong?
From where I sit, there is still one elephant in the room that could prolong this bear market—or change it into something much more serious, such as a global depression or a U.S. structural bear market. That elephant in the room is leveraged loans. The odds of leveraged loans taking us down this dangerous path are still quite low, especially in light of recent aggressive actions by the Fed and Congress. But we can’t overlook the degree to which the corporate world used historically low interest rates to take on excessive debt and leverage in recent years.
This strategy greatly increases the probability of a “debt cascade” if we don’t get America back to work soon. Again, we need to solve the global health crisis before worrying too much about the economy. But, getting companies to generate cash flow in a swift fashion will greatly minimize the chance of a “default tsunami.” The shadowy leveraged loan market has grown by over 50 percent in the U.S. since 2015 to $1.2 trillion. Like an over-levered household, the freeze on corporate cash flows leaves companies that have leveraged loans on their books in danger of collapse.
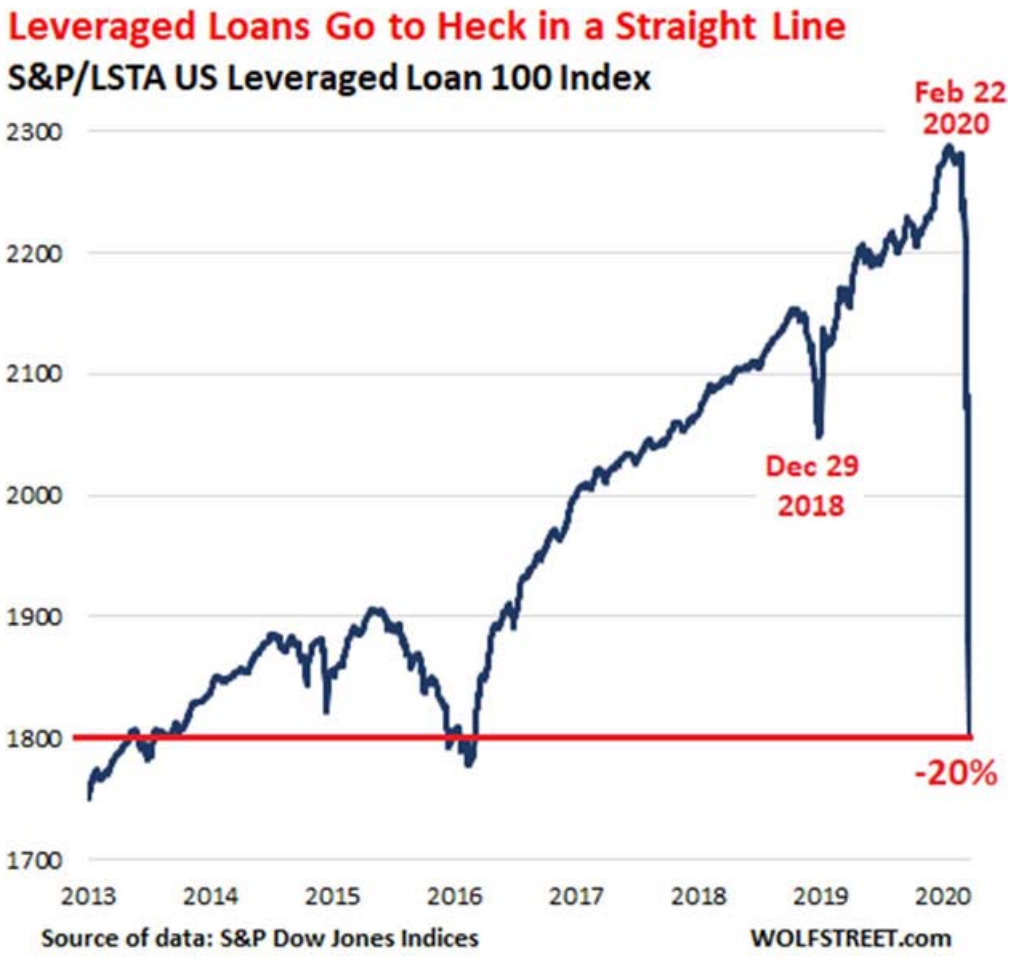
Leveraged loans blow out. Distressed corporate debt spikes
by Wolf Richter
This is the moment when yield-chasing turns into a massacre.
Warren Buffett, (aka the Oracle of Omaha) admitted he had no idea what the future held for interest rates and further, he didn’t think it was important to know. He said trying to predict the direction of interest rates isn’t any more useful than predicting what business is going to do, or what the stock market’s going to do. “I can’t do any of those things,” quipped Buffett, “but that doesn’t mean I can’t do well investing over time.”
We have just absorbed a massive financial body blow unlike anything most Americans have seen before. Like the 9/11 terrorist attacks, American lives are at risk, but the pandemic is much worse in terms of its economic impact. I seriously doubt anyone had an economic model that could account for a scenario in which entire countries were being shut down for business long-term. It’s just too farfetched to consider.
I can only take comfort in knowing that we have a lot of smart people in the world, especially in science and medicine, who can put their heads together and eventually lead us out of this crisis. Saving as many human lives as possible is our top priority, but eventually the U.S. economy will flourish again as it always has after times of crisis. I have used a chart called “The Markets Response to a Crisis” in almost all of my quarterly letters. Remember, the market prices in recessions well before the economy goes through most of the downturn. In March, we saw the fastest 30 percent correction in U.S. history, not to mention only the fourth time since WW II that a 60/40 portfolio declined 20 percent. The market priced in both of those events.
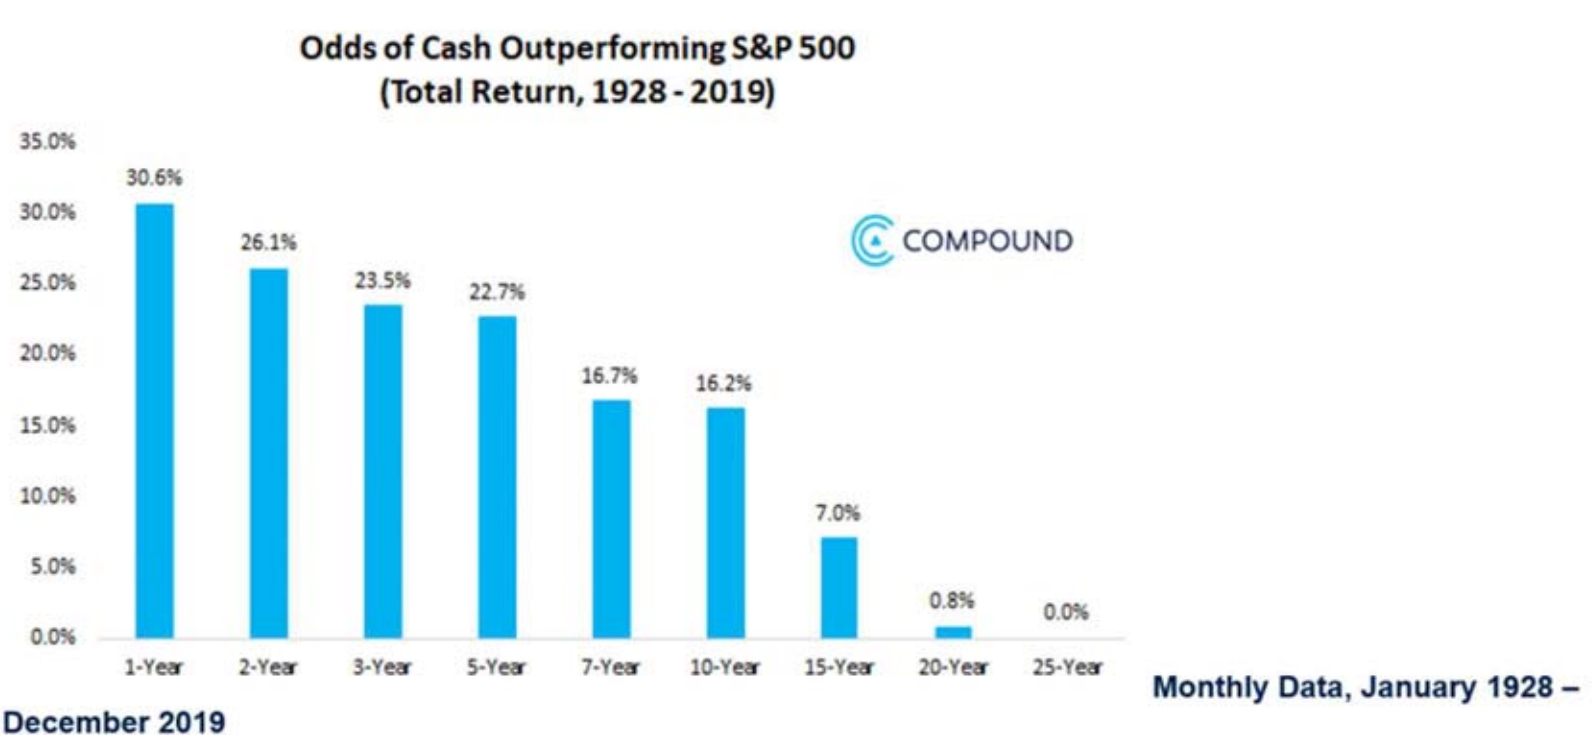
At this stressful and emotional time, many nervous people will tell you “cash is king.” Maybe it’s true if your family’s income (or business revenue) is in crisis mode. But, for everyone else, cash rarely wins. If you’re sitting on cash, you may want to consider the historical returns of cash versus equities.
Did you know that over the past 12 months, even with tremendous volatility and jaw-dropping declines, the Nasdaq is down less than
1 percent
and the S&P 500 is only down about
7 percent
. See Charlie Bilello’s analysis below:
Odds of cash outperforming the S&P

2000 bear
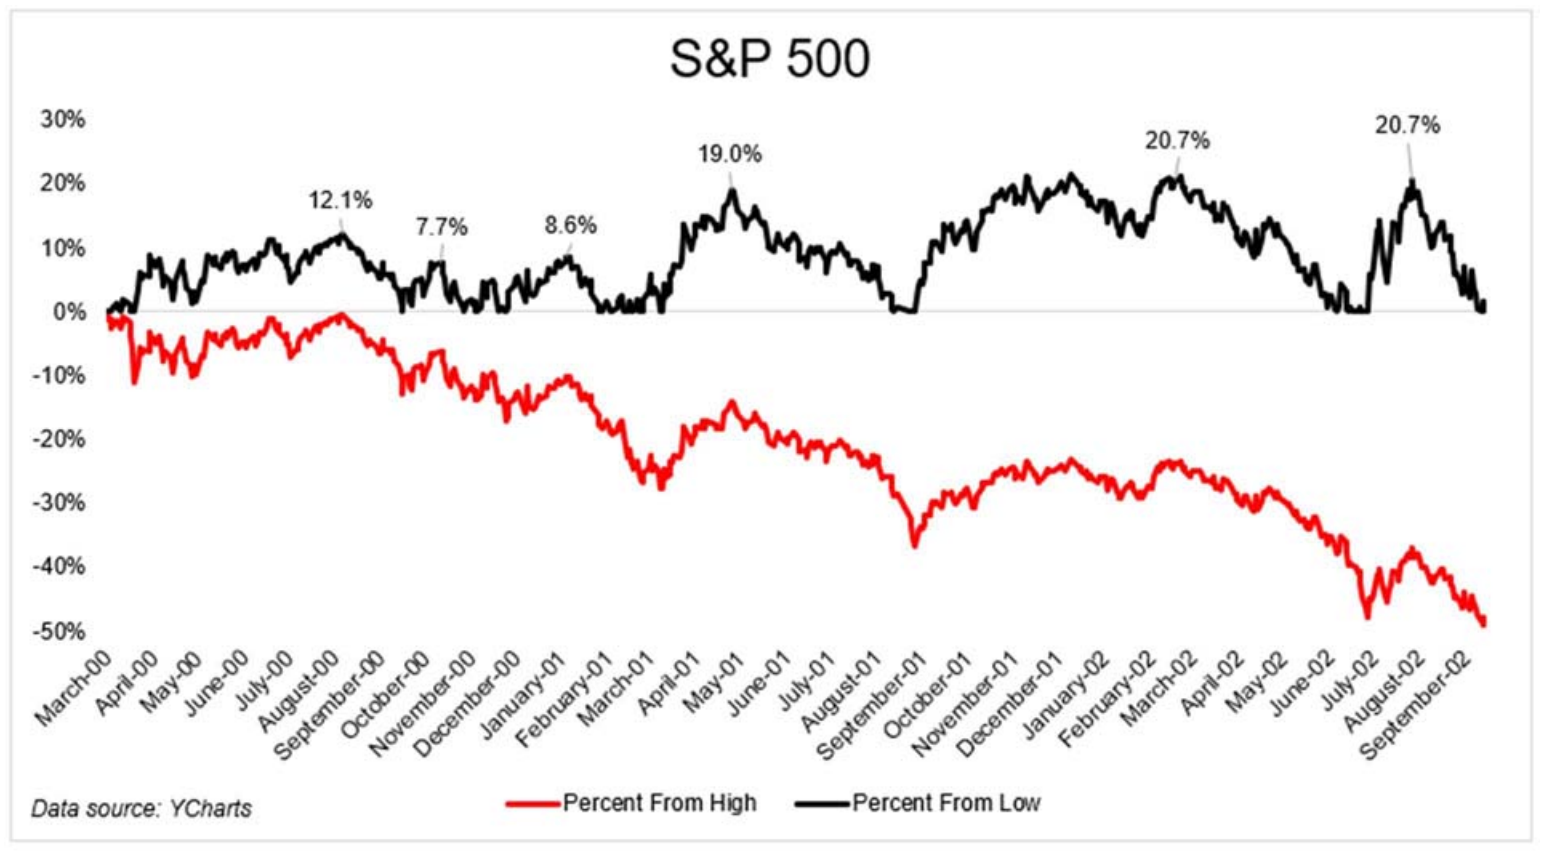
According to Batnick, the chart below shows the decline, in red, from the top in March 2000 to the bottom in 2002. It also shows several bounces from the lows, in black. You can see that there were plenty of times that traders and investors could have been fooled into thinking the worst was behind them.
Leveraged loans are up 50 percent since 2015
Leveraged loans, which are issued by overleveraged companies with insufficient cash flows, are part of what Wolf Richter recently called the “gigantic pile of risky corporate debt that is now being brutally repriced as concerns over credit risk (the risk of default) are finally bubbling to the surface.” According to Richter, the S&P/LSTA US Leveraged Loan 100 Index, which tracks the prices of the largest leveraged loans, has plunged by 20 percent since February 22nd.
According to Richter, leveraged loans “are traded in slices like securities or are packaged into highly rated Collateralized Loan Obligations (CLOs). But for years, investors had the hots for them, driven by their relentless chase for yield, in a world of interest rate repression.”
These companies, noted Richter, were often acquired by private equity firms through leveraged buyouts, which means they loaded up those companies with lots of debt. In addition, “PE firms extracted special dividends from their companies,” which were funded by leveraged loans. That’s a form of asset stripping and it leaves the company “more leveraged, more precarious and more likely to topple. But who cares? Those were the good times and the chase for yield was on,” lamented Richter.