KEY TAKEAWAYS
- Politics change, management teams change and taxes change, but human nature never changes.
- The U.S. will see another 1999-type bubble, but those conditions do not exist in today’s tech market.
- Only one thing scares me right now about the stock market: Everyone I know is bearish or waiting for a pullback rather than seeking out opportunities.
INTRODUCTION
This long-running hot streak in the tech sector has led to forecasts of another 1999 bubble. It has sparked future doom from a host of soothsayers, who have been waiting for their gloomy predictions to come true since the global financial crisis ended in 2009. Since the crisis, today’s Wall Street Masters of the Universe are not the traders popularized in Michael Lewis’s original book “Liars Poker.” Nor are they the superstar investment bankers of the Internet boom. Instead, they’re a bunch of unknown hedge fund managers that predicted a crash in 2008 and made a fortune in its aftermath. Since that event, headline grabbers on Wall Street have shifted from tireless cheerleaders of the rising bull market to pessimists predicting the next crash.
I just finished a fabulous Warren Buffet biography by Roger Lowenstein titled Buffet-The Making of an American Capitalist that provided many thought-provoking descriptions of Buffet’s personal life which help explain his controlled temperament for investing. One part of the book that made me muse over today’s market was the observation that Wall Street veterans took 25 years to become bullish again after the 1929 crash. The scars were so deep then that even Benjamin Graham, the scion of value investing and Buffet hero questioned his entire thesis about value investing. Echoes of 1929 have followed the most hated bull market in history as it roars through its eighth year. Valuations are indeed on the high end and a correction may be due in the near future, but a bubble crash is another story.
I started my career on the trading desk in 1997 during the height of the Internet bubble. My firm was a small cap tech-oriented shop, so my trading introduction was baptism by (technology stock) fire. I will deviate from my mantra of not making predictions right now and just say that today’s market is absolutely nothing like the market we had during the 1999 bubble. In 1998, I remember one day waiting patiently for my car to be serviced and the mechanics kept running on and off the shop floor to check the computers in the main office. They weren’t looking at diagnostics for my car. They were day trading stocks and landscapers were leaving their jobs back then to be day traders at 100-1 intraday leverage. Today these same citizens, hopefully wiser, have moved all their money to Vanguard and now swear by passive indexing.
Today’s tech sector valuations are certainly not cheap, but it’s a tough argument to say they fit the bubble label. The P/E ratio for technology stocks is now 19-times next year’s earnings, vs. 17.7x for the S&P 500. Compare those ratios to a 54 PE during the March 2000 bubble. Even after the torrid start to 2017, tech stocks trade on par with their 20-year price-to-book ratio relative to the S&P 500. But, based on price-to-earnings, they carry a relative valuation that is 22 percent below their 20-year historical average relative to the S&P 500.
In 1999, the Nasdaq doubled in value as investors bought tech stocks at the expense of every other sector and the index dropped at least 2 percent on 40 different days that year. That’s a very different environment from the record low volatility we have today. In 1999, people were cruising around my parking lot at work with personalized license plates boasting ticker symbols like QCOM (Qualcomm). Do you really see that today?

“Tiny Bubbles”
Tiny bubbles (tiny bubbles)
In the wine (in the wine
Make me happy (make me happy)
Make me feel fine (make me feel fine)
— Don Ho
IPO Market Comparison
Let’s start by comparing IPO markets of the dot-com era to today. In 1999, we had 446 tech IPOs and in 2000 we had 333 tech IPOs. By contrast, we had just 98 IPOs in 2016.
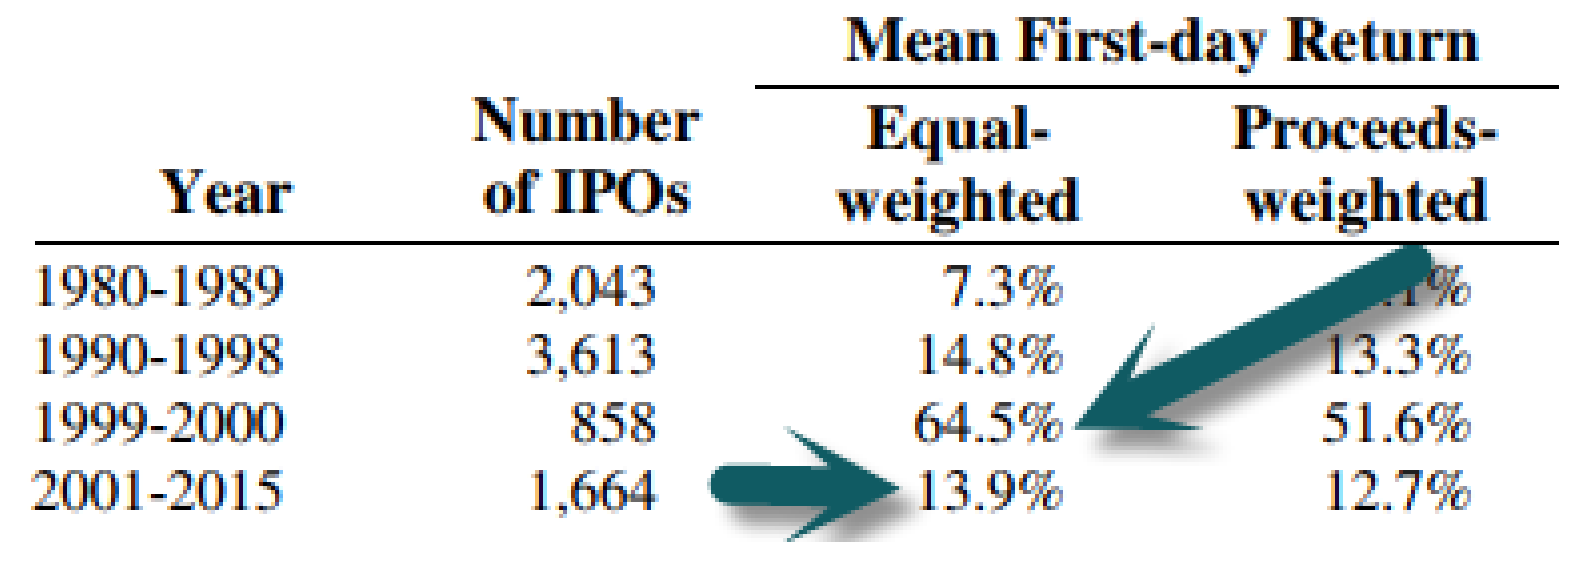
The average first-day returns for the 1999-2000 IPO market were 64 percent compared to 14% between 2001 and 2015. In 1999 and -2000 three out of four (75%) new offerings were tech stocks compared to just one in four (27%) today. Also the small company IPO market (for
companies with under $50 million in sales) has almost disappeared from the marketplace as private equity has filled the gap. In 1999 and 2000, three out of five IPOs (60%), were for companies with under $50 million in sales. Today that number is closer to one in twenty (5%) of deals.
Tech Versus the Market
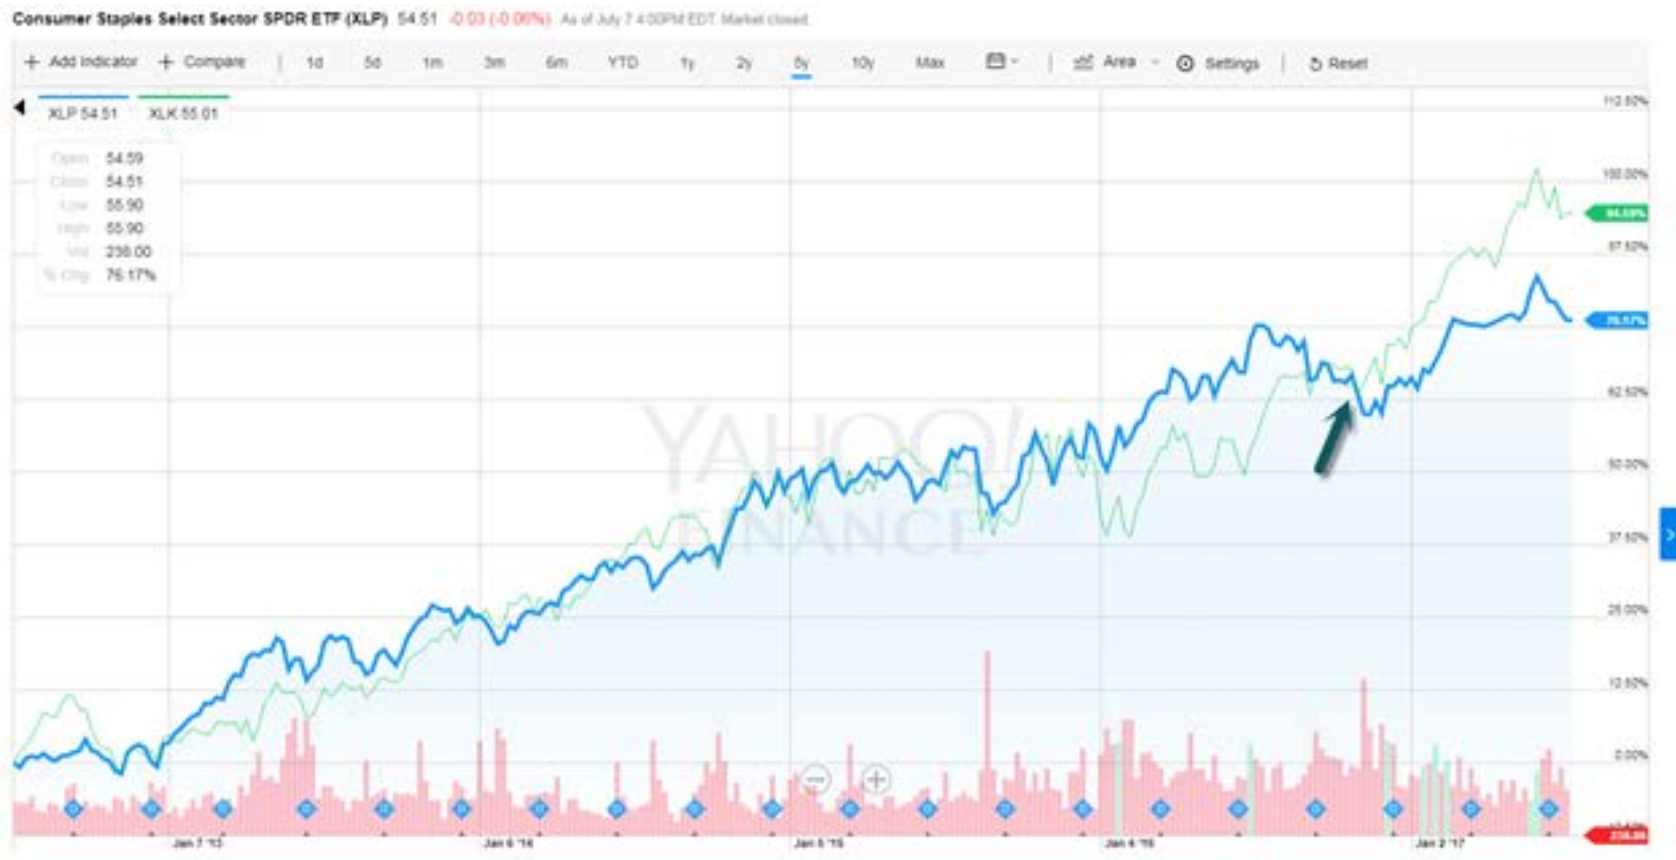
Tech just overcame the defensive consumer staples sector on a 5 year basis at the end of 2016. In 1999 and 2000, money stopped flowing to any sector but tech. Every other asset class was undervalued except technology stocks: Bonds, housing, value stocks, dividend stocks, international equities etc. Today, you could make a sound argument that defensive areas of market are the most overvalued–U.S bonds, dividend payers and low volatility stocks are trading at record valuations.
On a 5-Year basis….Tech just exceeded the performance of consumer staples this year.
XLP CONSUMER STAPLES ETF VS. XLK TECHNOLOGY SECTOR ETF-TECH JUST TOOK THE LEAD AT THE END OF 2016.
What did tech look like in 1999 vs. consumer staples? Try a 5x valuation.
Tech: End of the Bubble or Start of the Secular Recovery?
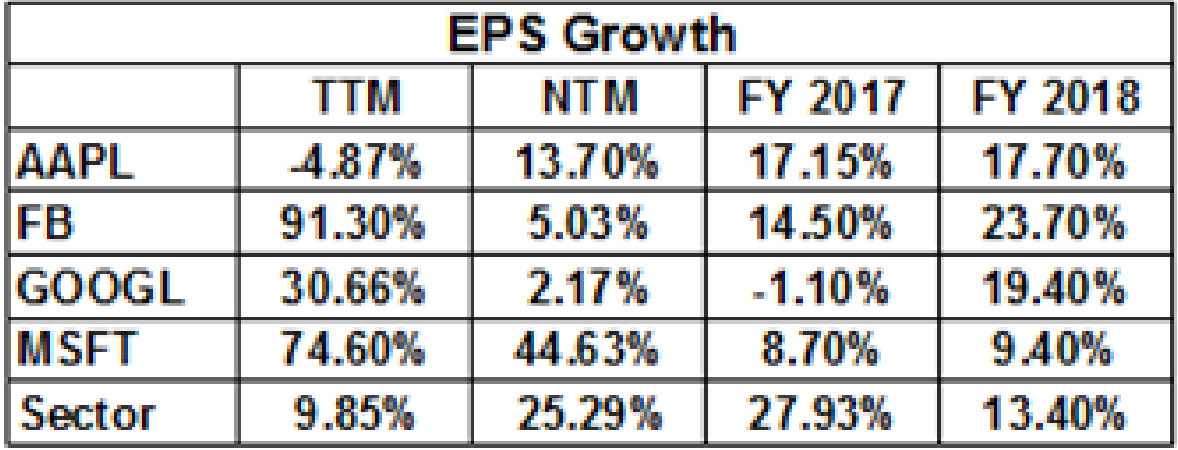
Tech bubble predictions begin with the FANG stocks (Facebook, Amazon, Netflix and Google) which are driving a large part of the sector’s outperformance. But, they are also growing revenues and (in some cases) earnings at double digit rates.
TECH VS. CONSUMER STAPLES 1999
Could FANG stocks suffer a 20-percent correction at any moment? Of course, I would expect tech to correct more than broader market would in the next sell off. But, a short-term correction of an overheated sector is certainly not the same as a secular technology bear market. What does the big picture look like for tech today compared to conditions that lead up to the 1999 bubble?
Conclusion
Most of my readers have heard me repeat that the crisis of 2008 left the biggest investing hangover in the U.S. since the crash of 1929. Plus, it created a new cottage industry of bubble spotters including fresh MBAs who want to devote their time to finding the next crash instead of recommending the next AAPL. Behavioral finance will tell you that both paths are equally difficult to follow, if not impossible. So as investors, we are better off staying focused on a disciplined strategy.
Politics change, management teams change and taxes change, but human nature never changes. In my lifetime, the U.S. will see another 1999-type bubble, but those conditions do not exist in today’s tech market. Expect a correction in technology stocks especially FANG names, but put that in perspective of the NASDAQ’s 78 percent drop from peak to bottom in 2000.
You might be interested to know that in 88 out of the last 89 years, we have seen a market correction of at least 5 percent, and in 67 out of the past 89 years, we have experienced a 10 percent correction or more. I don’t lose sleep worrying about the next pullback. Only one thing scares me right now about the stock market–everyone I know is bearish or waiting for a pullback. On another note, until Vanguard stops buying $3 billion per day of FANG stocks, I’m don’t see how they will go down in value.
So here’s to the golden moon
And here’s to the silver sea
And mostly here’s a toast
To you and me
— Don Ho Tiny Bubbles
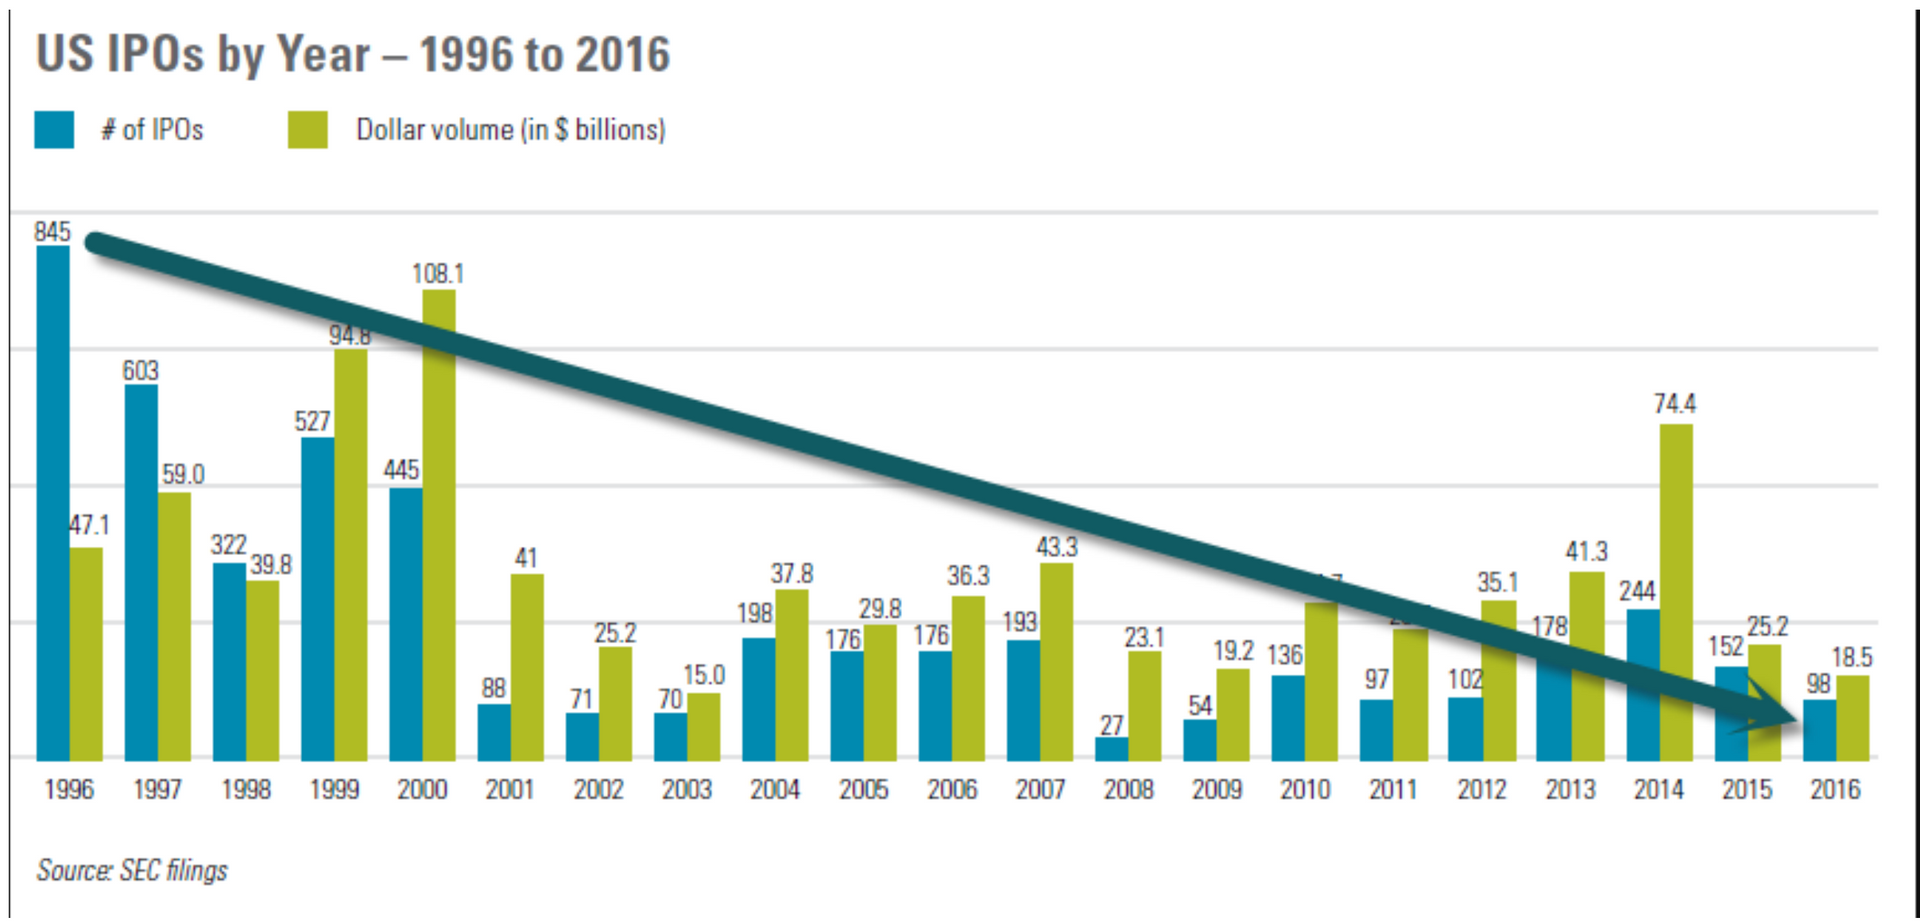
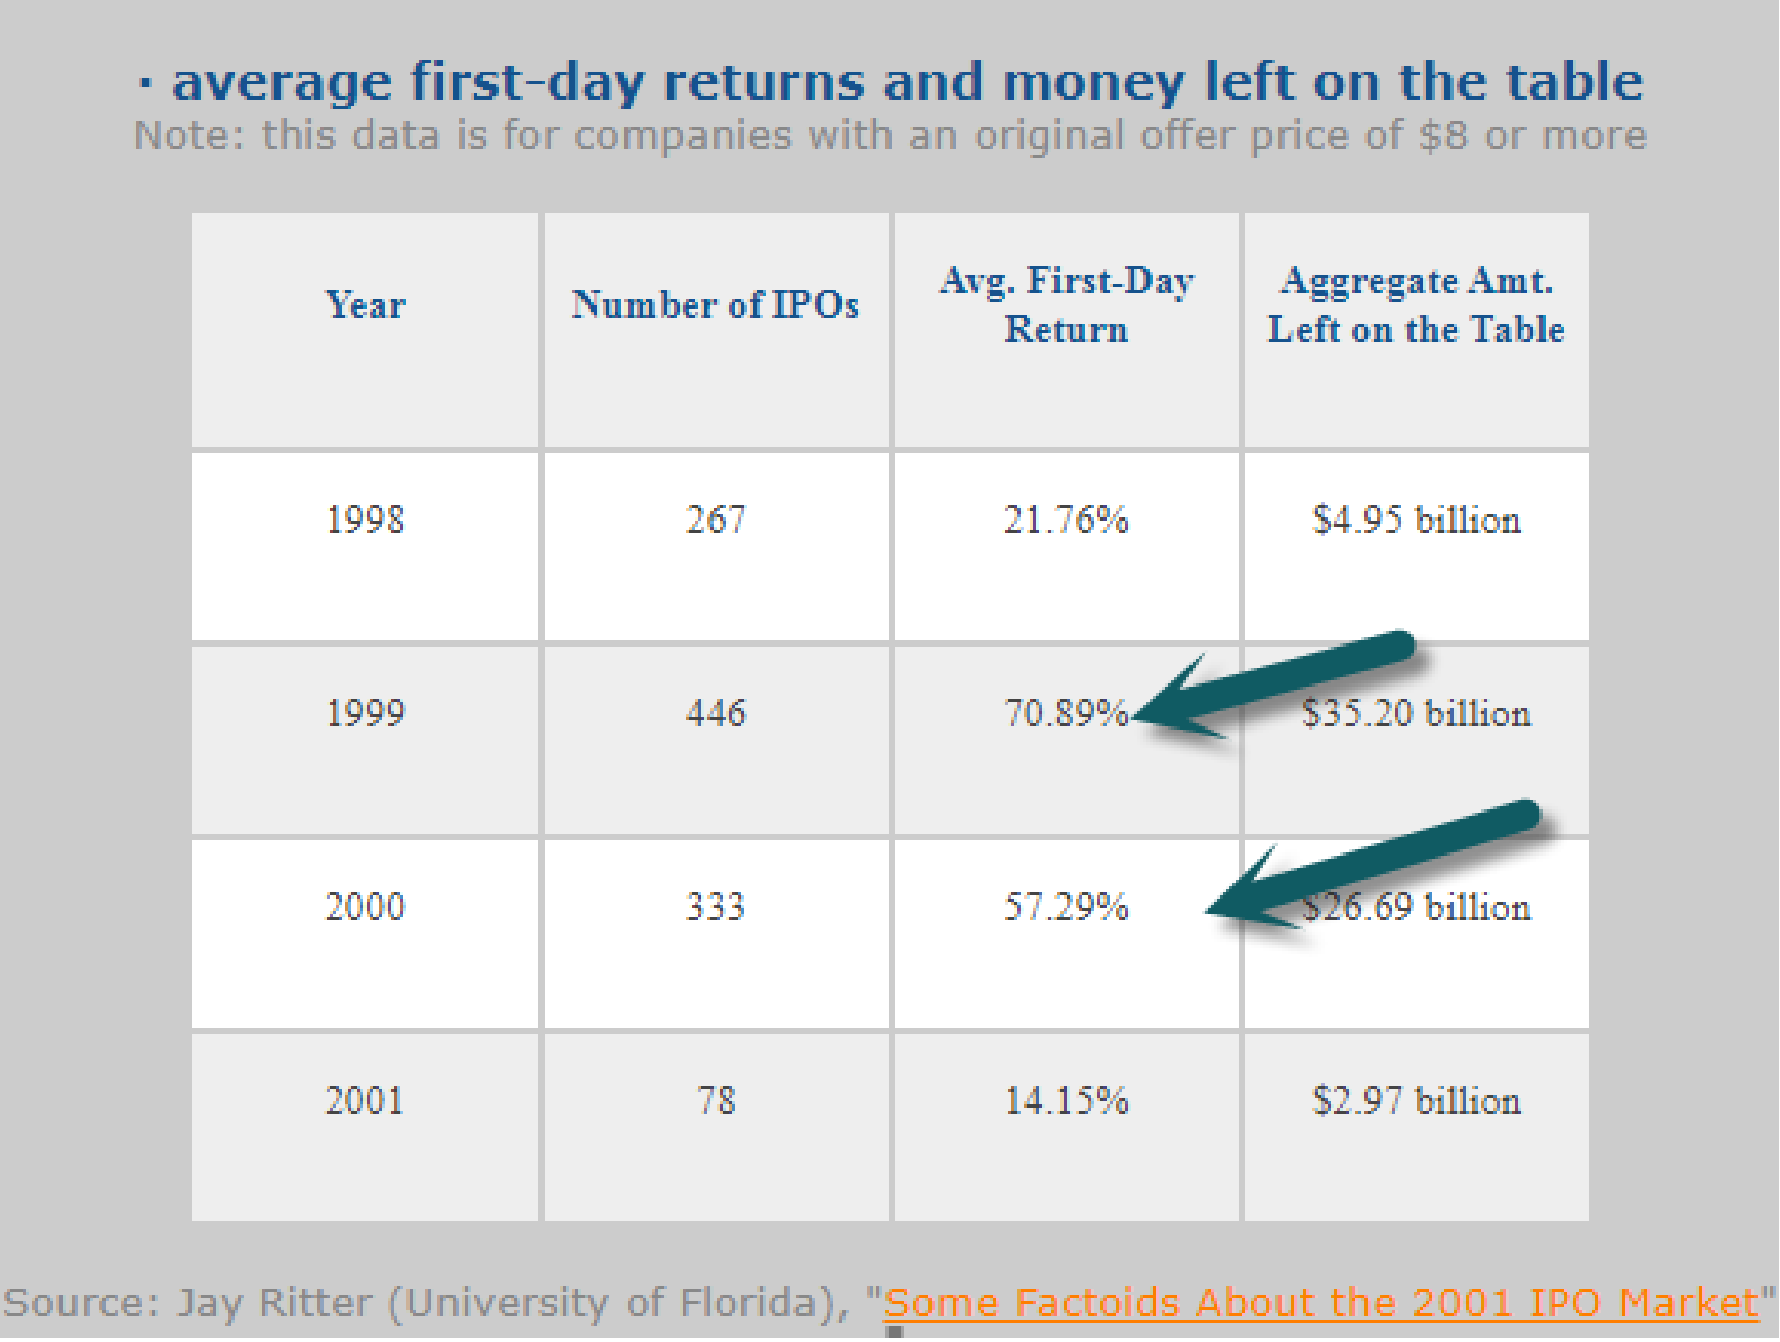
AVERAGE FIRST DAY RETURNS IPO MARKET
AVERAGE FIRST DAY IPO RETURNS
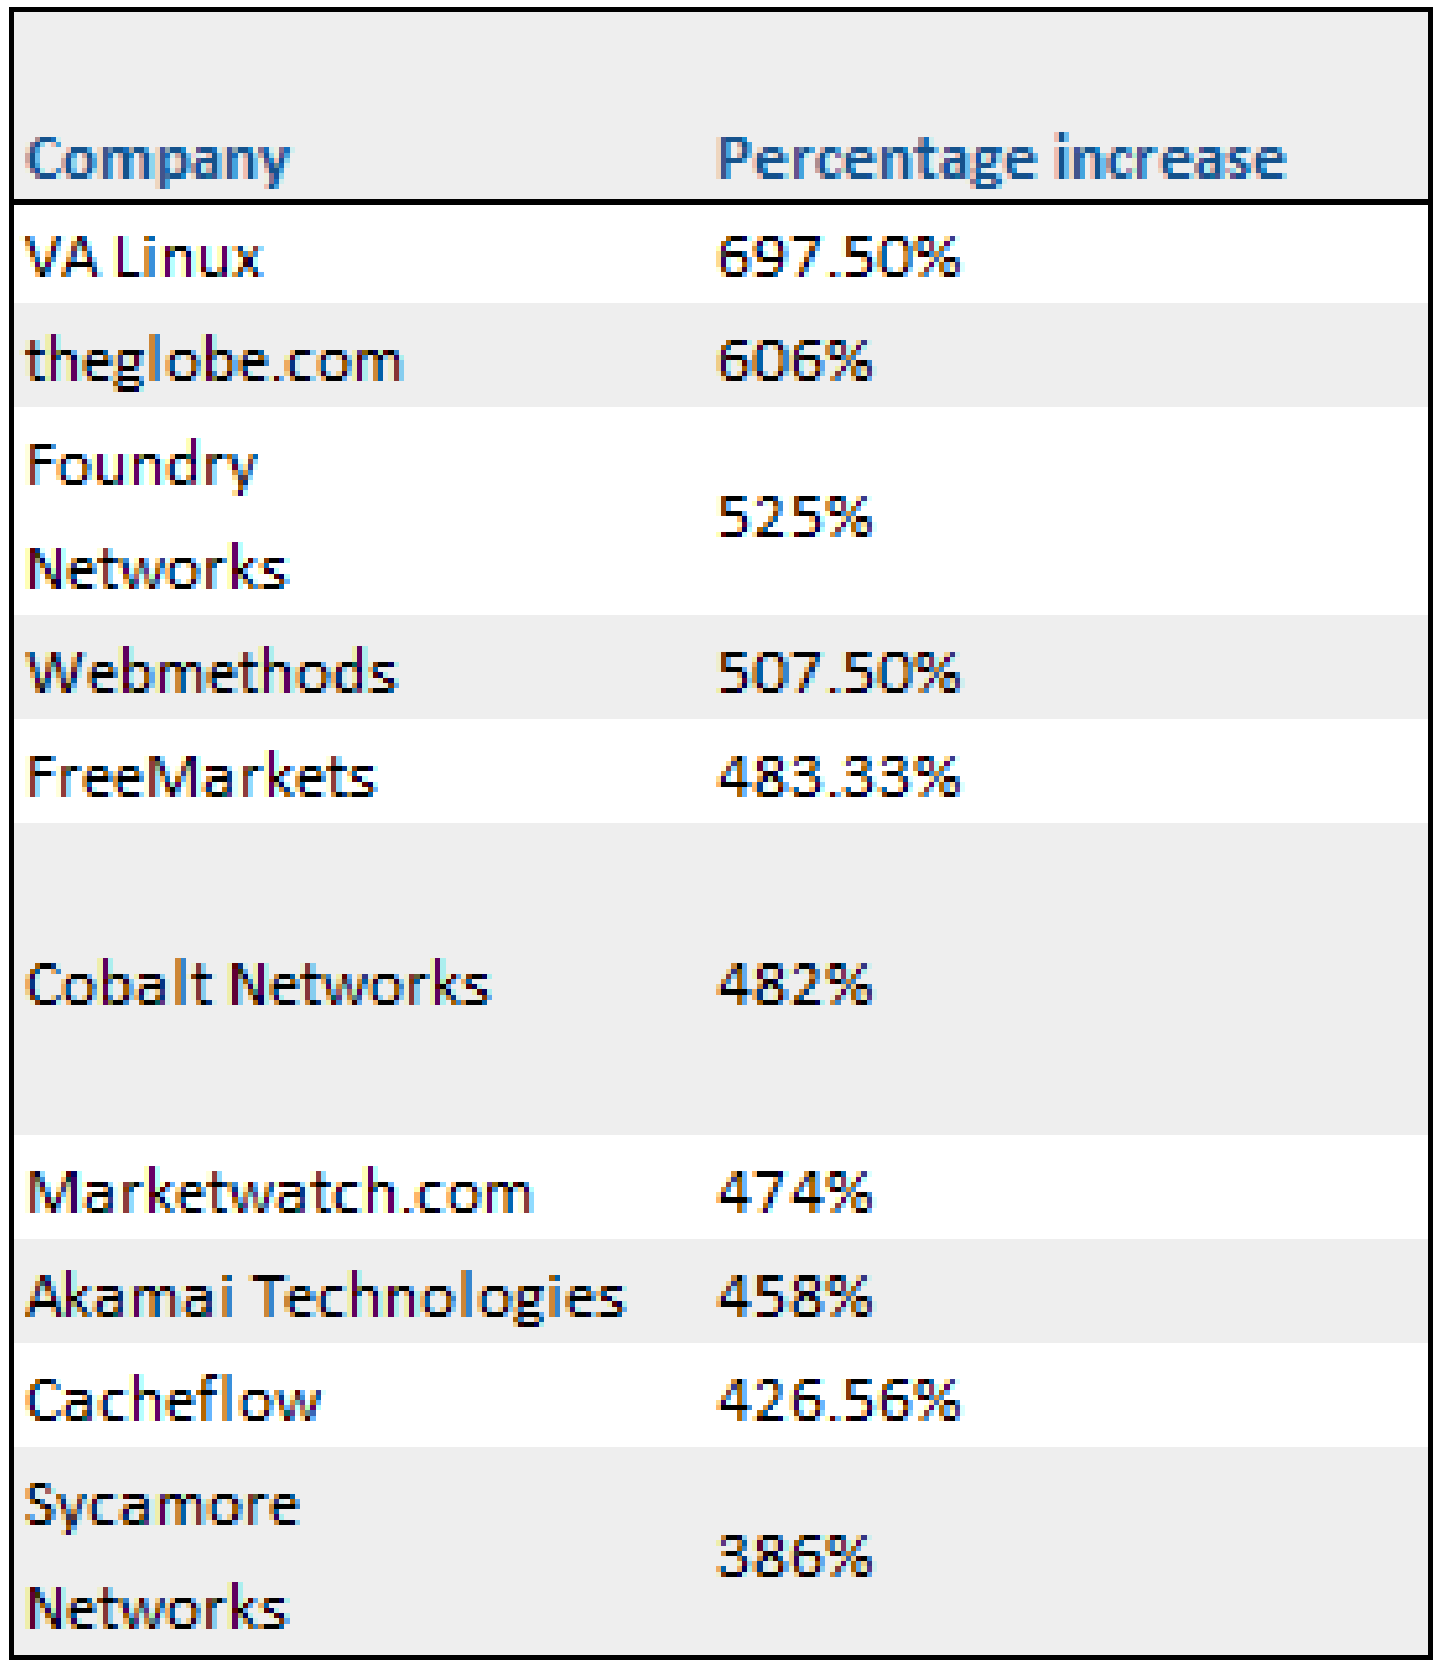
TOP 1-DAY “POPS” IN 1999. WHEN WAS THE LAST OPENING DAY IPO THAT LOOKED LIKE THIS TABLE BELOW?
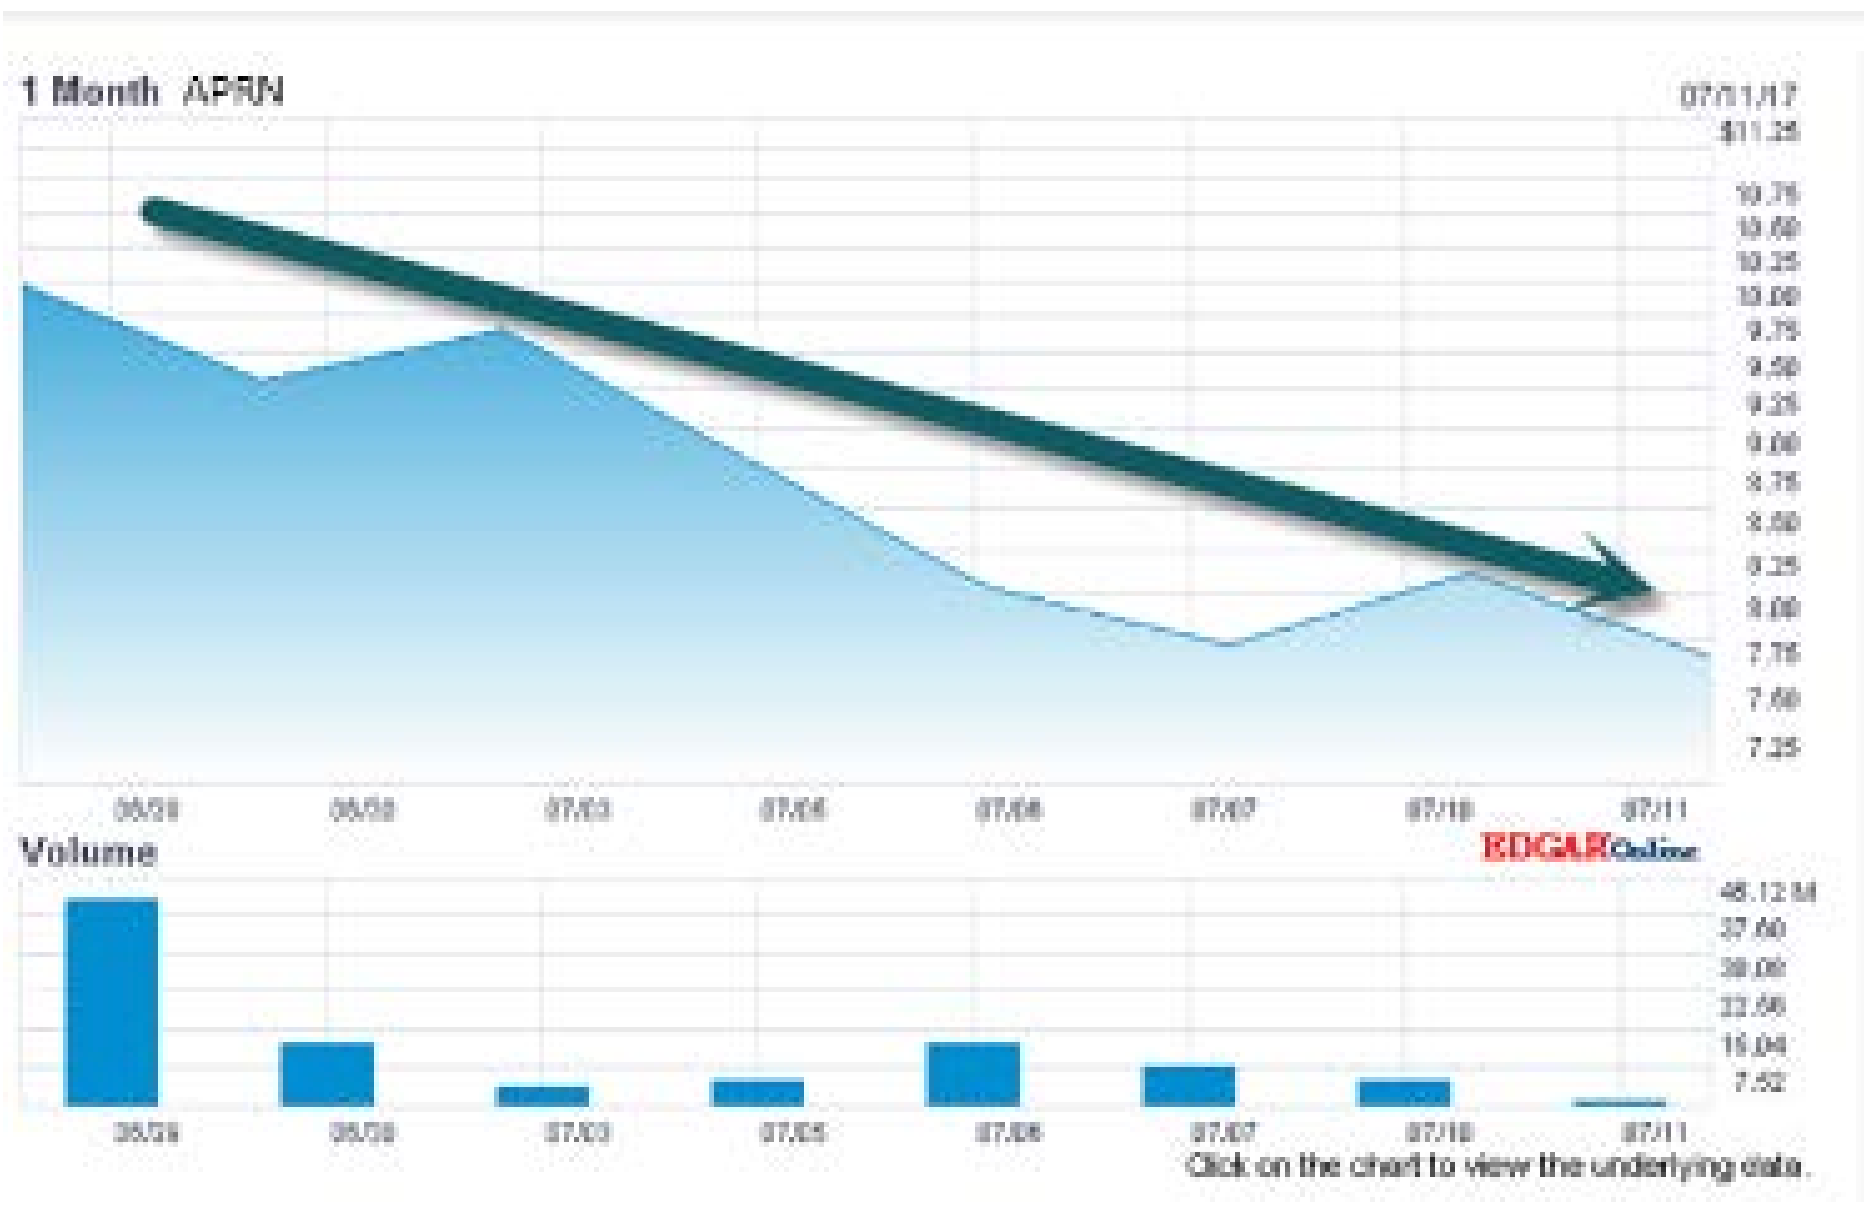
HERE IS THE LATEST 2017 TECH IPO THAT CAME WITH NO
PROFITS- BLUE APRON (APRN). EXPECTED PRICE $15-
$17…OPENED AT $10, SOLD OFF TO $7.50
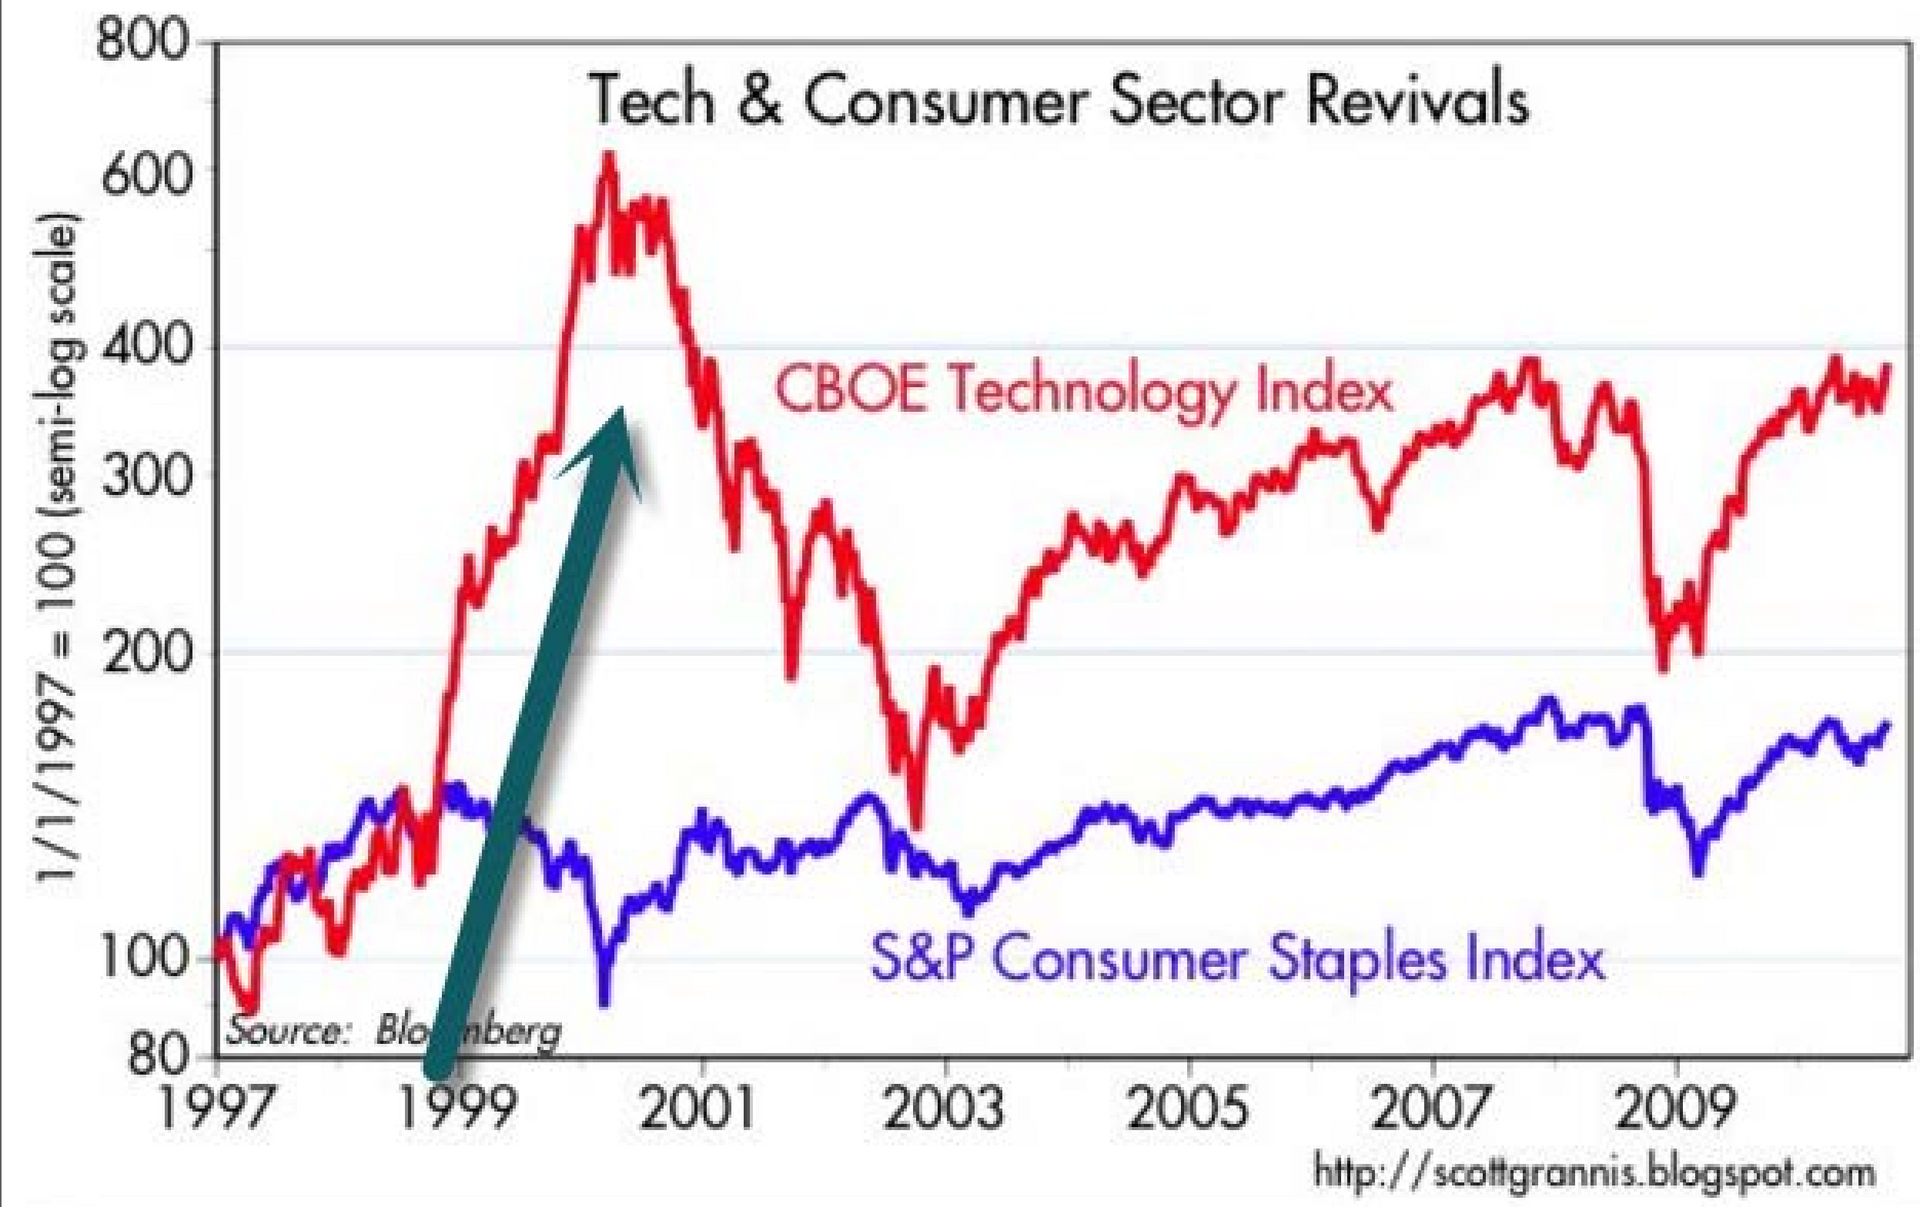
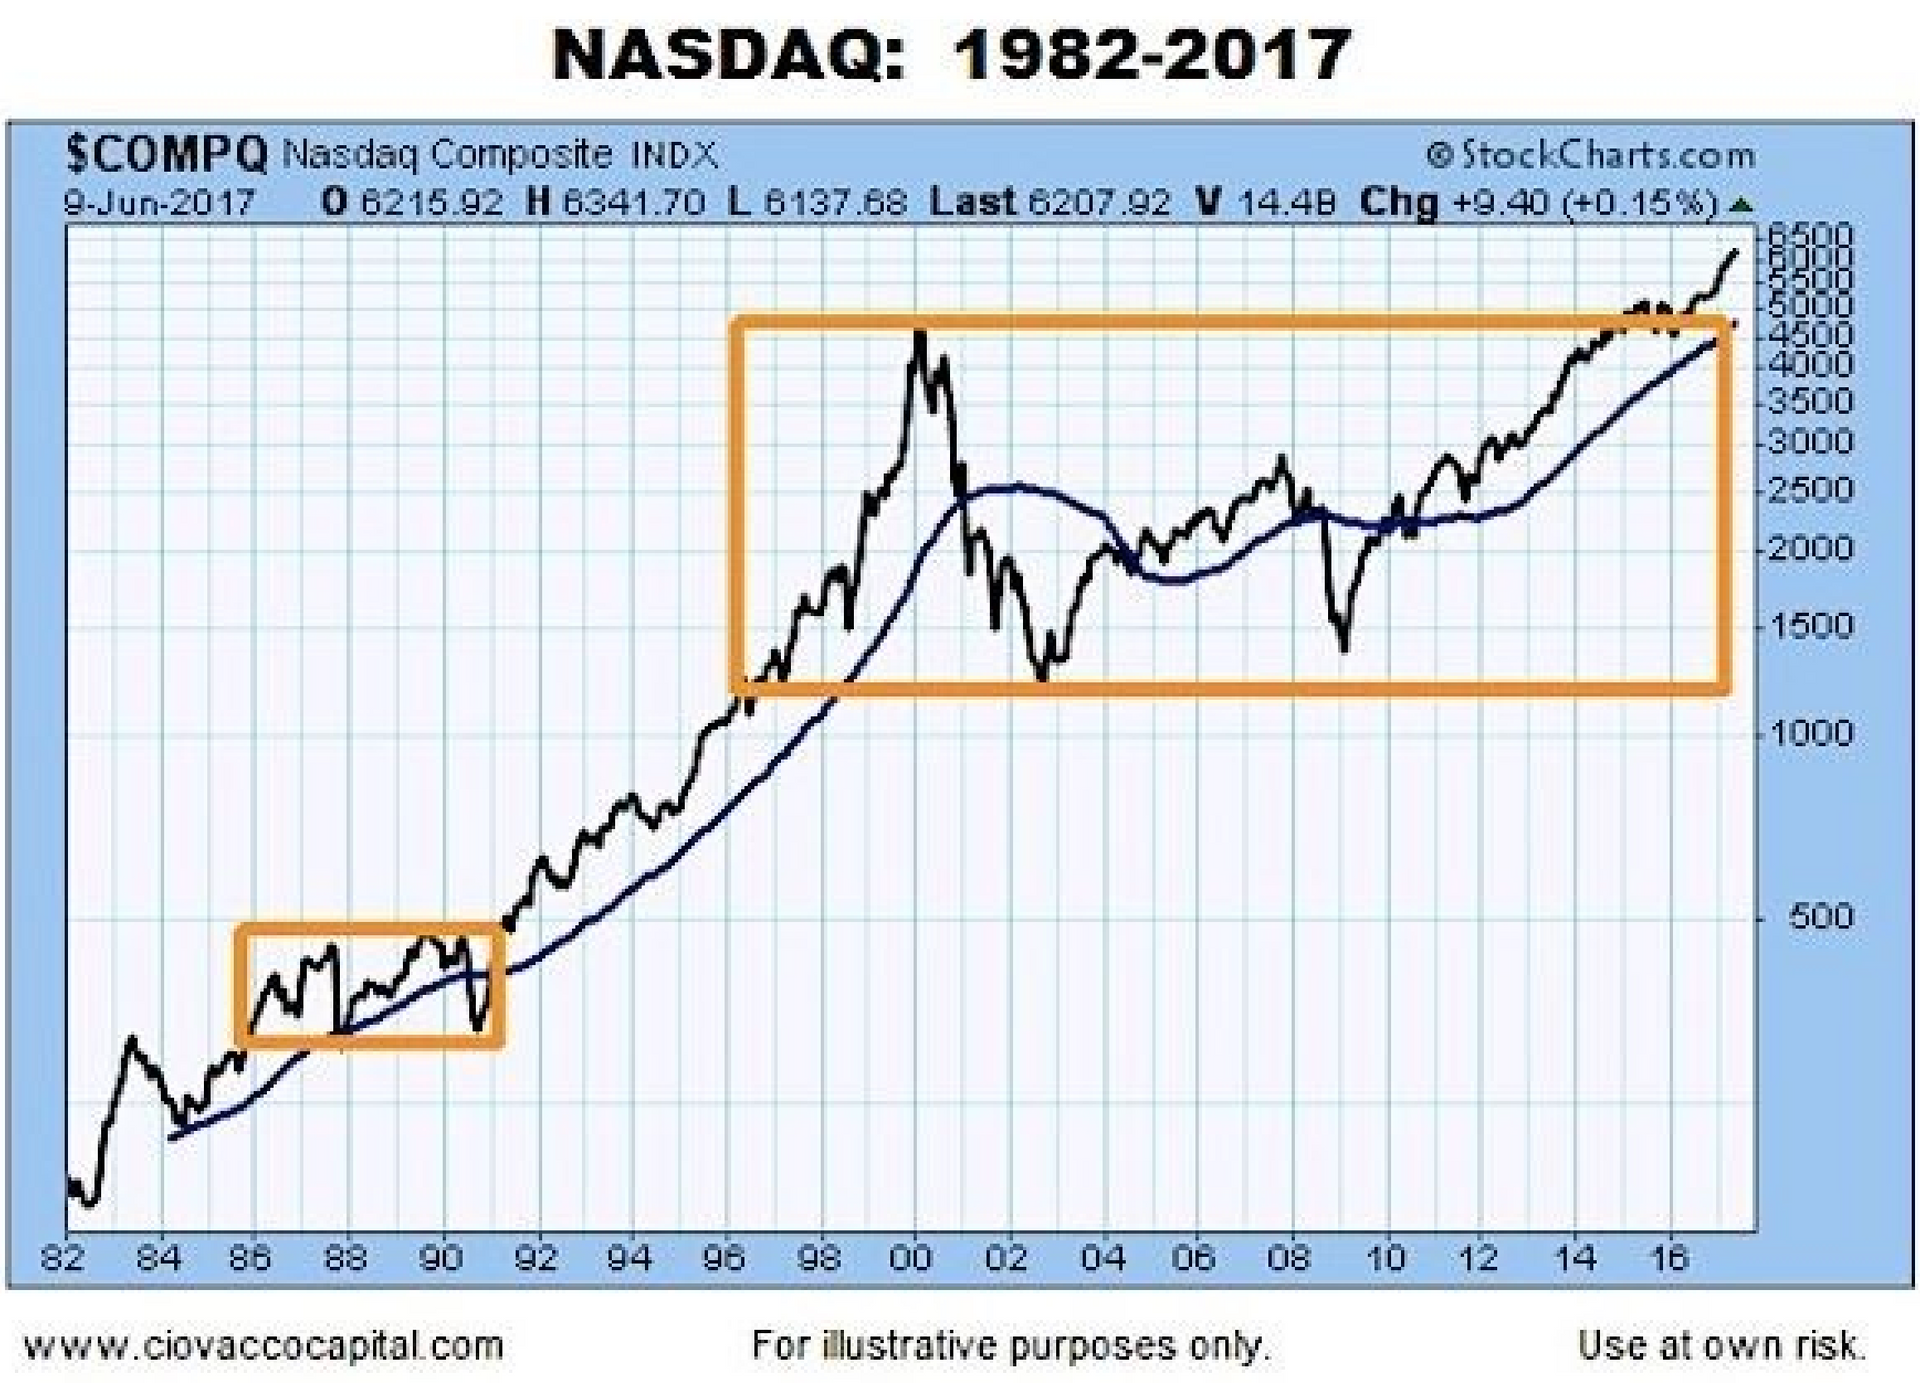
TECH IS JUST BREAKING OUT OF A 20 YEAR CONSOLIDATION.
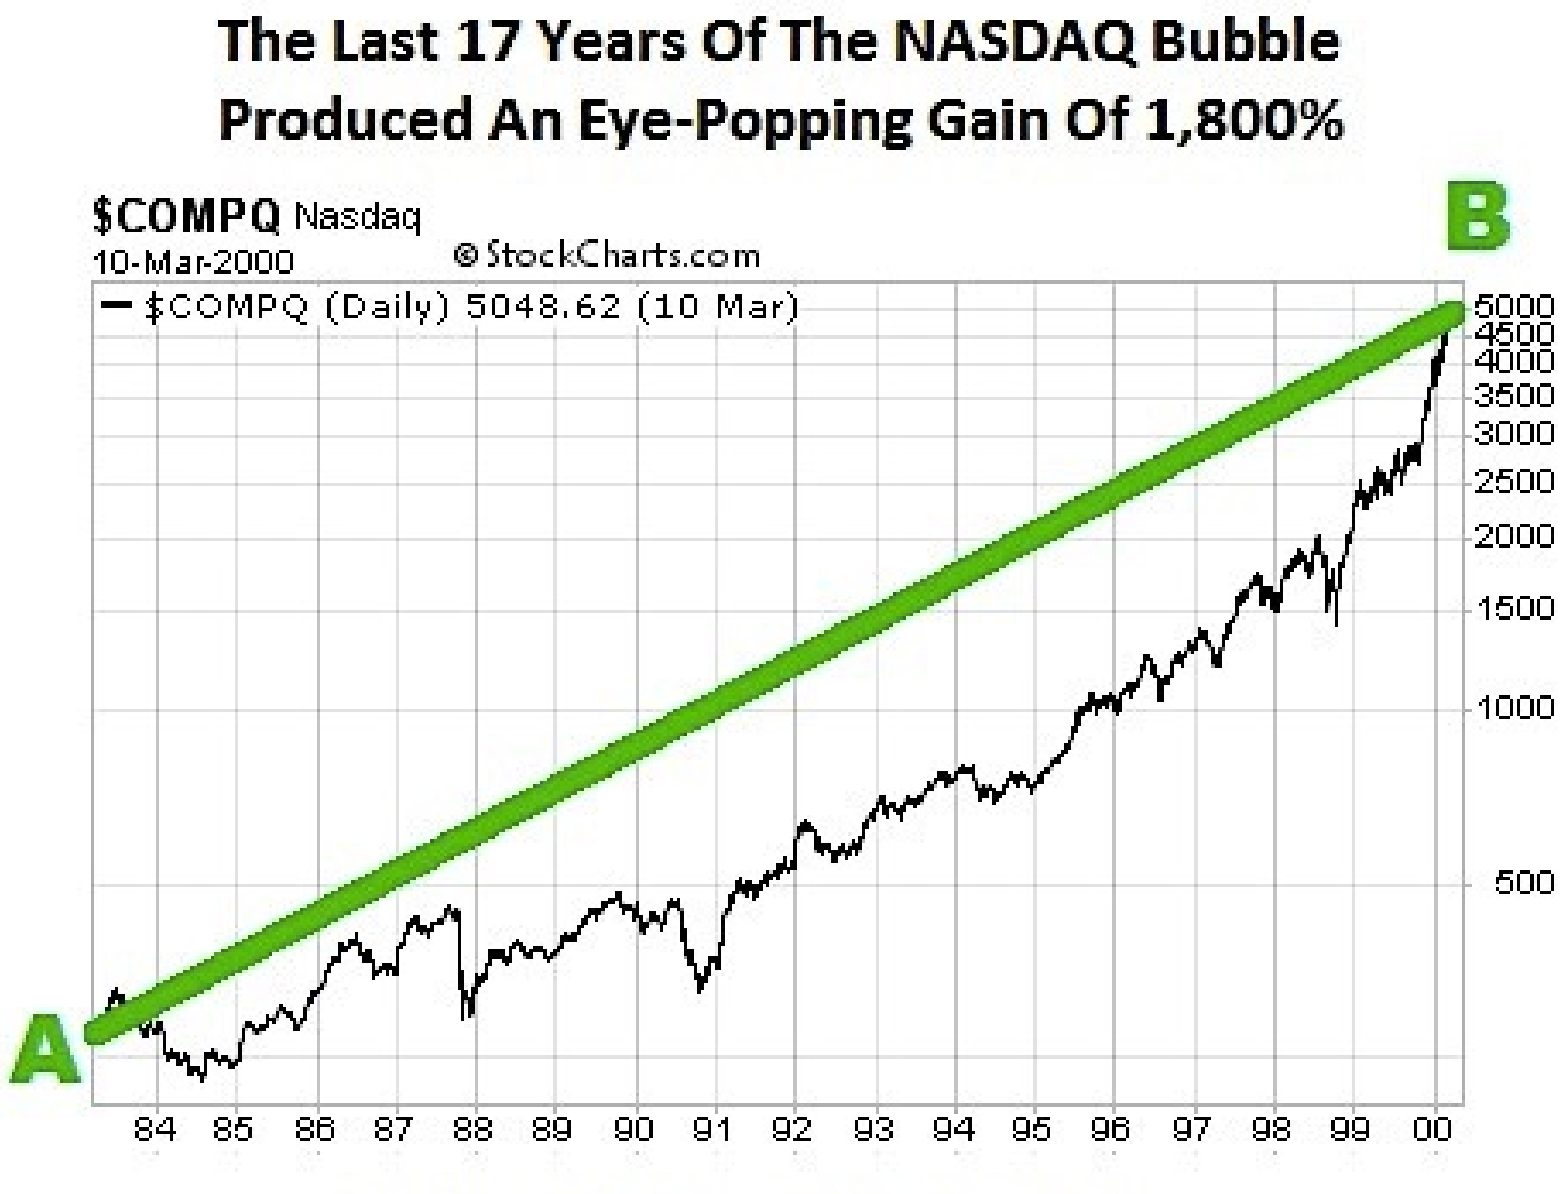
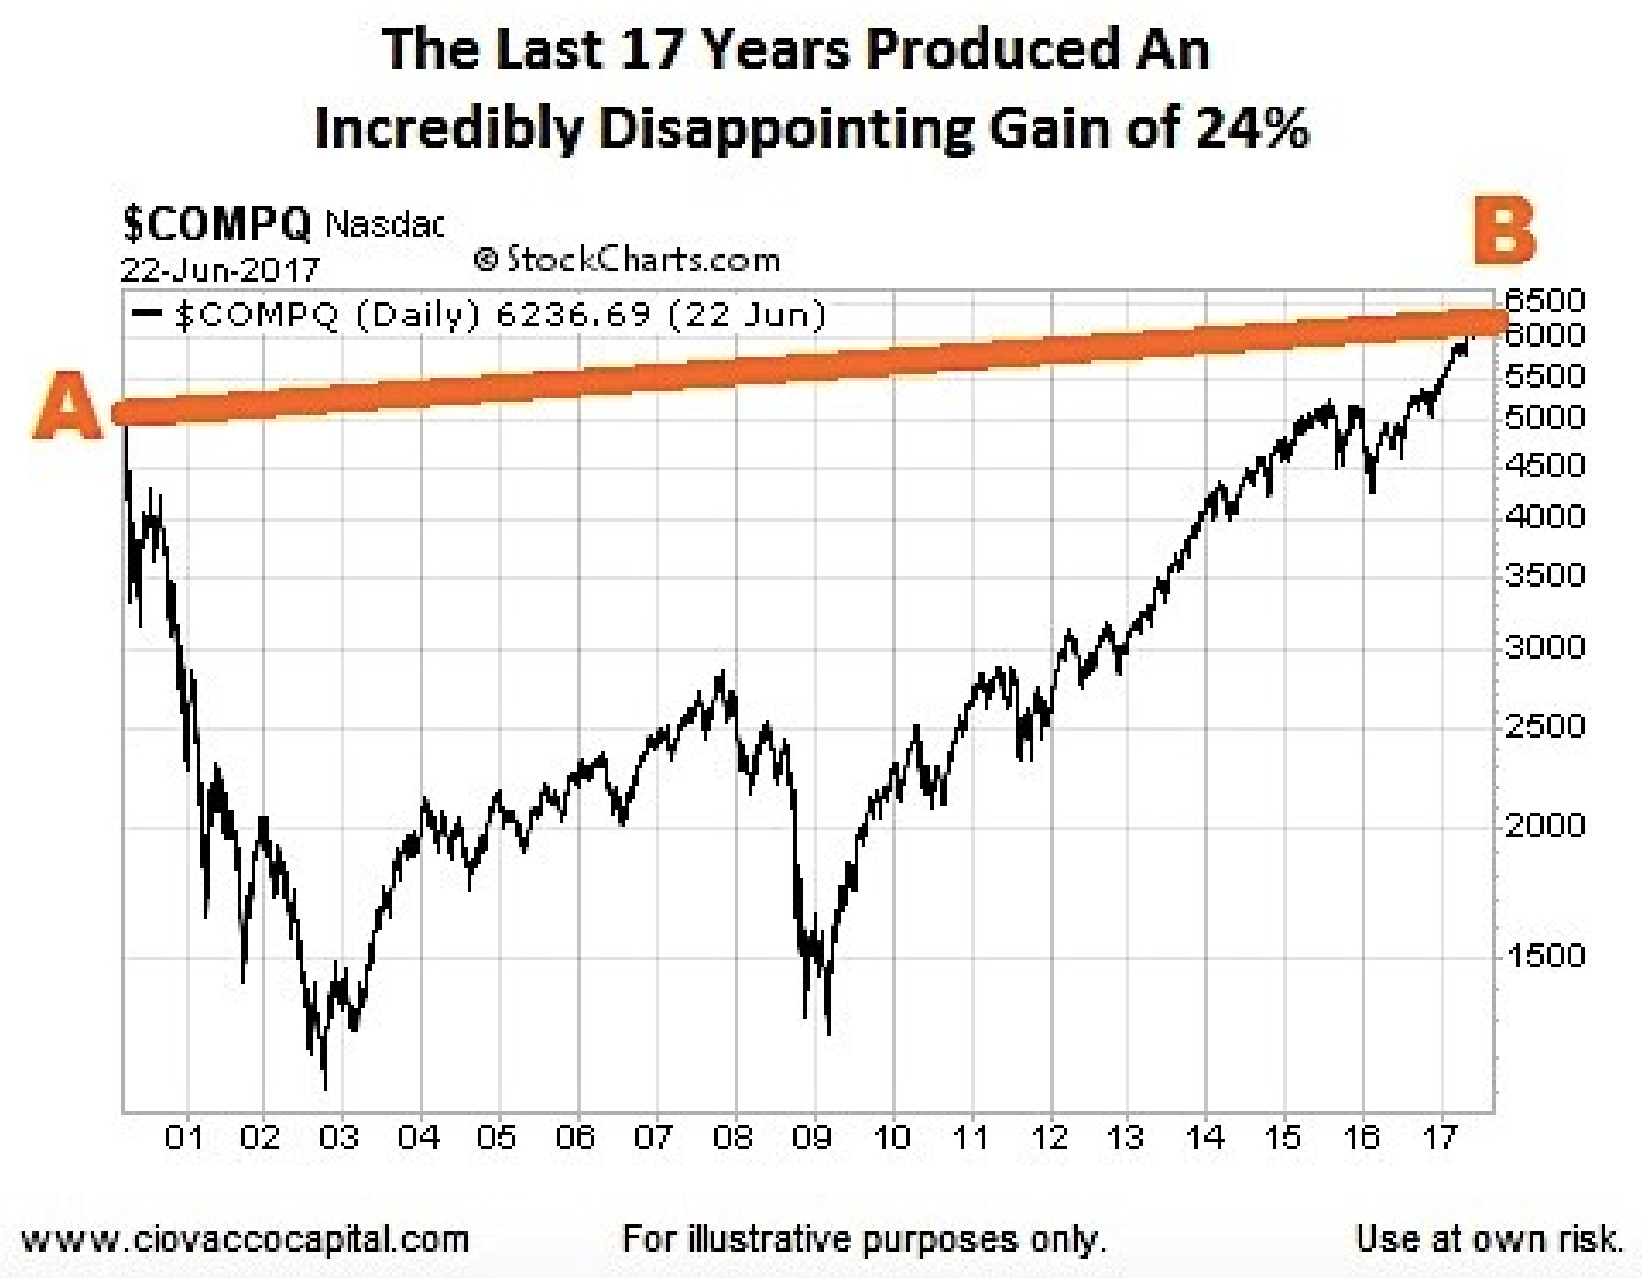
1984-2000 NASDAQ +1800% VERSUS 2000-2017 +24%
Picture 1 (1983-2000). Picture 2 (2000-2017).