
Introduction
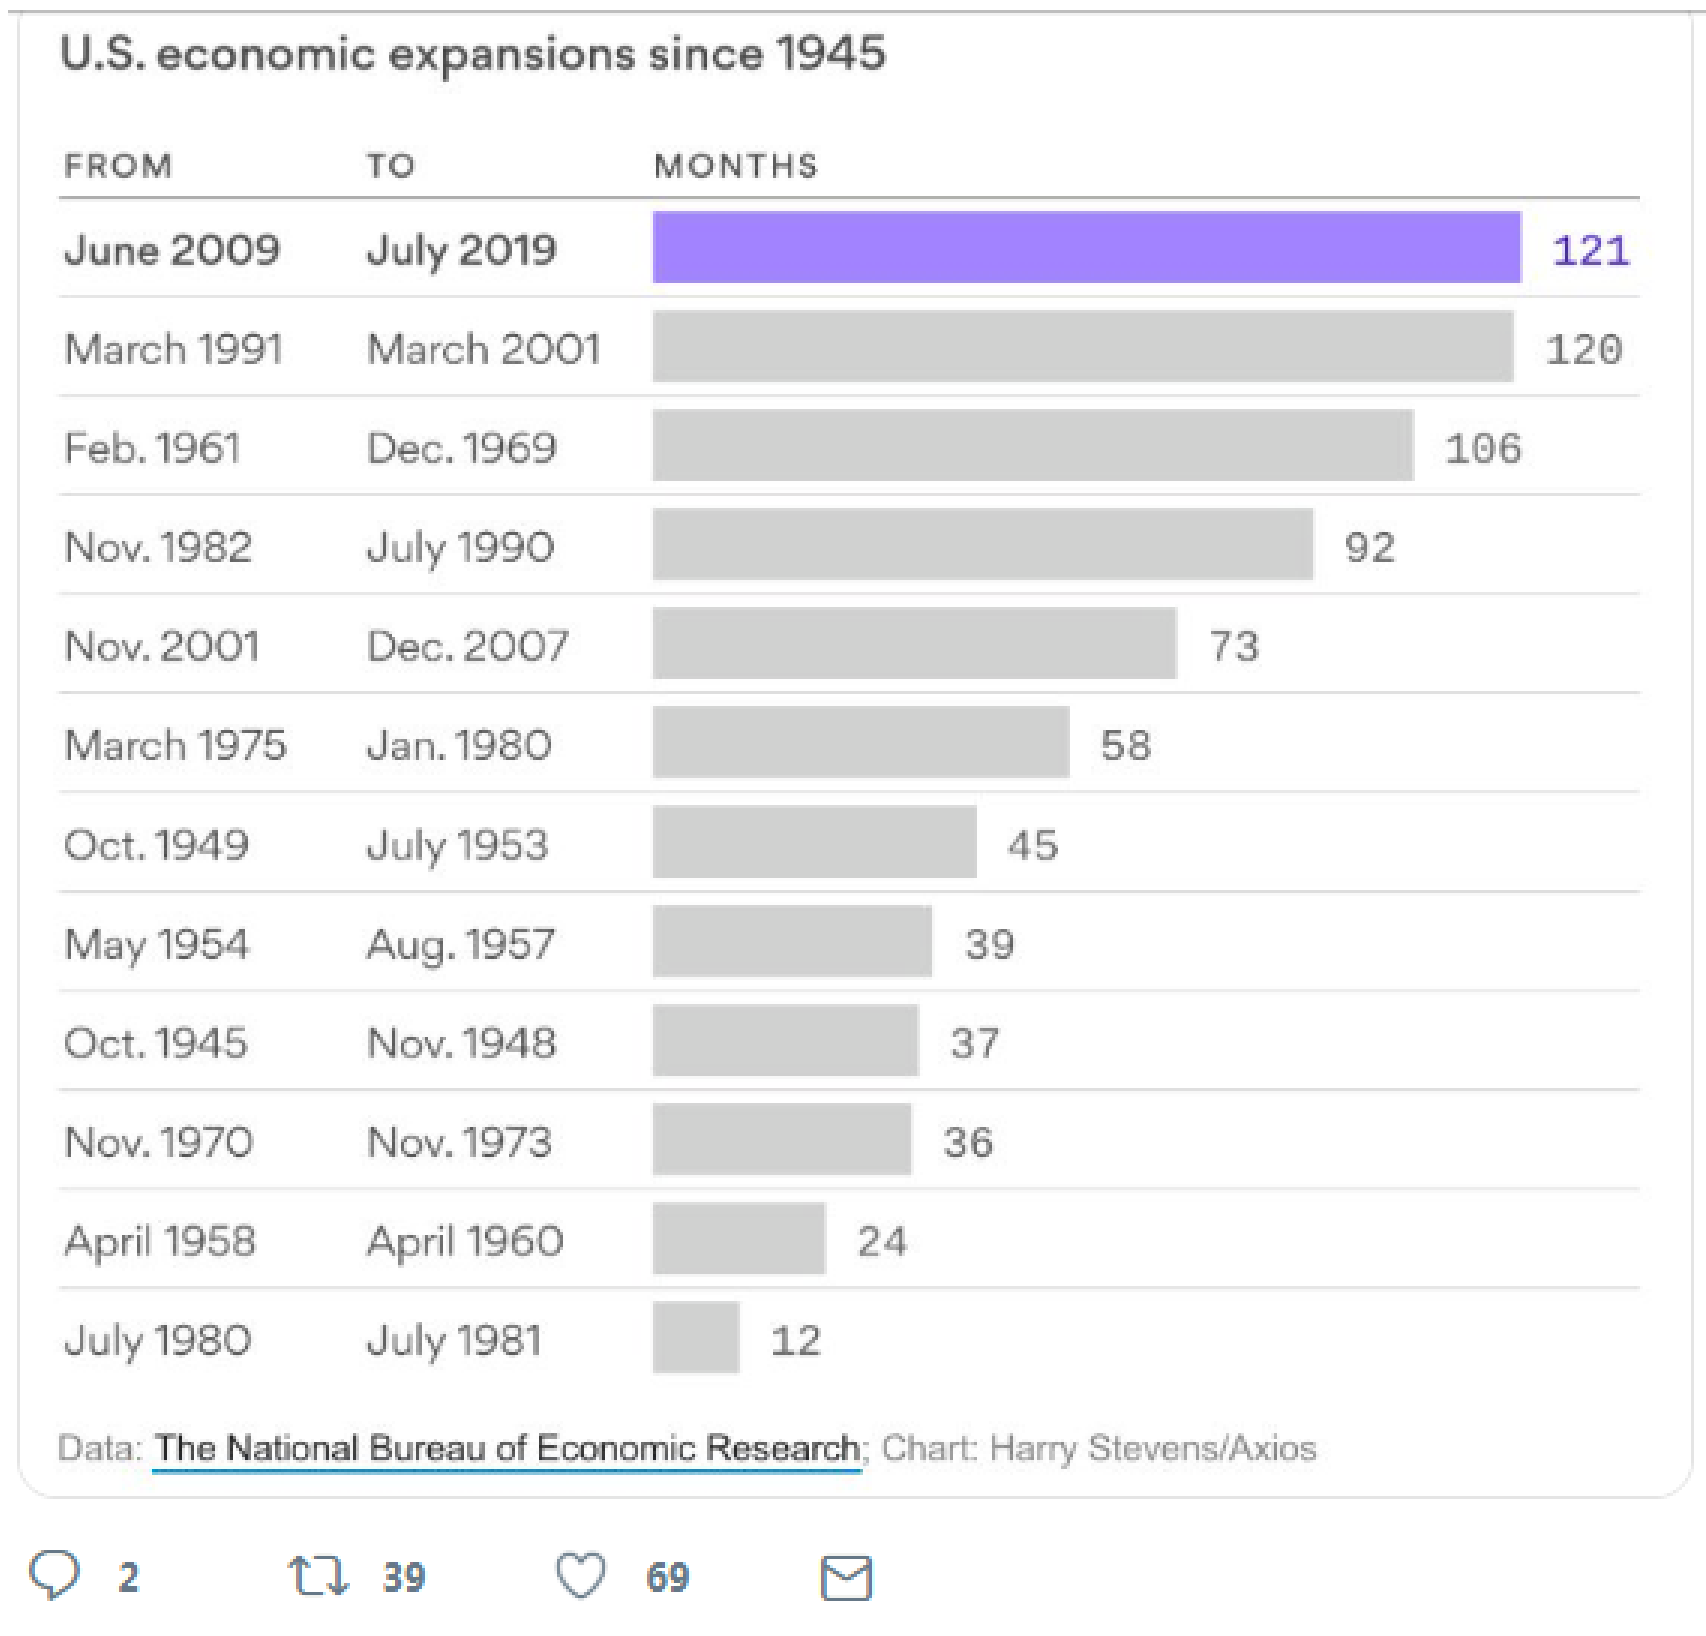
It’s official. July 1st marked the date of the longest economic expansion in U.S. history. As the Beatles sang in their iconic anthem, “Let It Be,” every time the night gets cloudy for this bull market there is still a light that manages to shine through. Will this record-setting expansion shine until tomorrow? Should you just sit by patiently and let it be? These are questions that have been vexing economists and financial advisors for quite some time, so let’s try to bring some clarity.
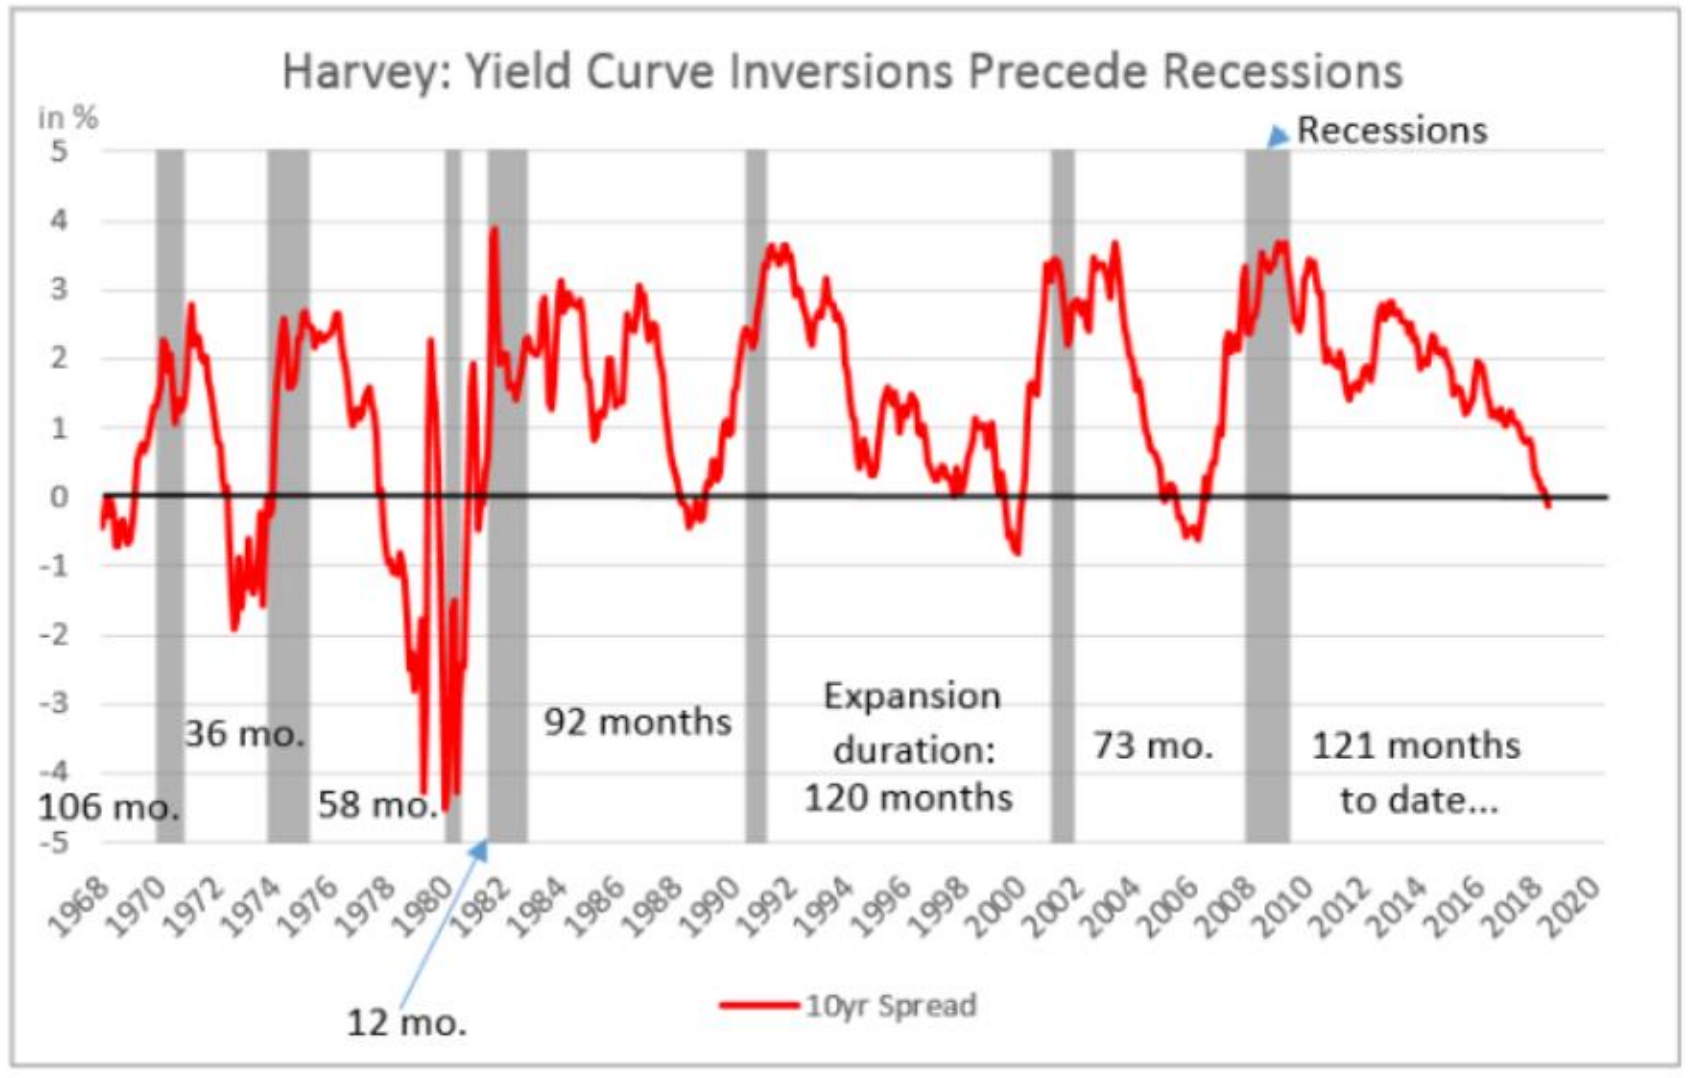
Yes, the U.S. economy is in the midst of its longest expansion on record—121 months and counting--but some other milestones are being surpassed that could change the dynamic of this market. Take interest rates. As mentioned in my letter to you last quarter, the U.S. yield curve has inverted for the first time since 2007. True, the curve initially corrected itself after inverting earlier this year, but it quickly inverted again and has remained that way for over 30 days. Again, an inverted yield curve means investors are being paid more for holding very short term debt than they are for holding long-term debt. It’s counter-intuitive and usually means investors are very nervous about the future.
“Let It Be”
The Beatles
And when the night is cloudy there is still a light that shines on me
Shine until tomorrow, let it be
I wake up to the sound of music, Mother Mary comes to me
Speaking words of wisdom, let it be
Let it be, let it be, let it be, yeah, let it be
There will be an answer, let it be
Let it be, let it be, let it be, yeah, let it be
There will be an answer, let it be
Let it be, let it be, let it be, yeah, let it be
Whisper words of wisdom, let it be
Songwriters: John Lennon / Paul McCartney
Let It Be lyrics © Sony/ATV Music Publishing LLCo
4 major themes dominating global markets
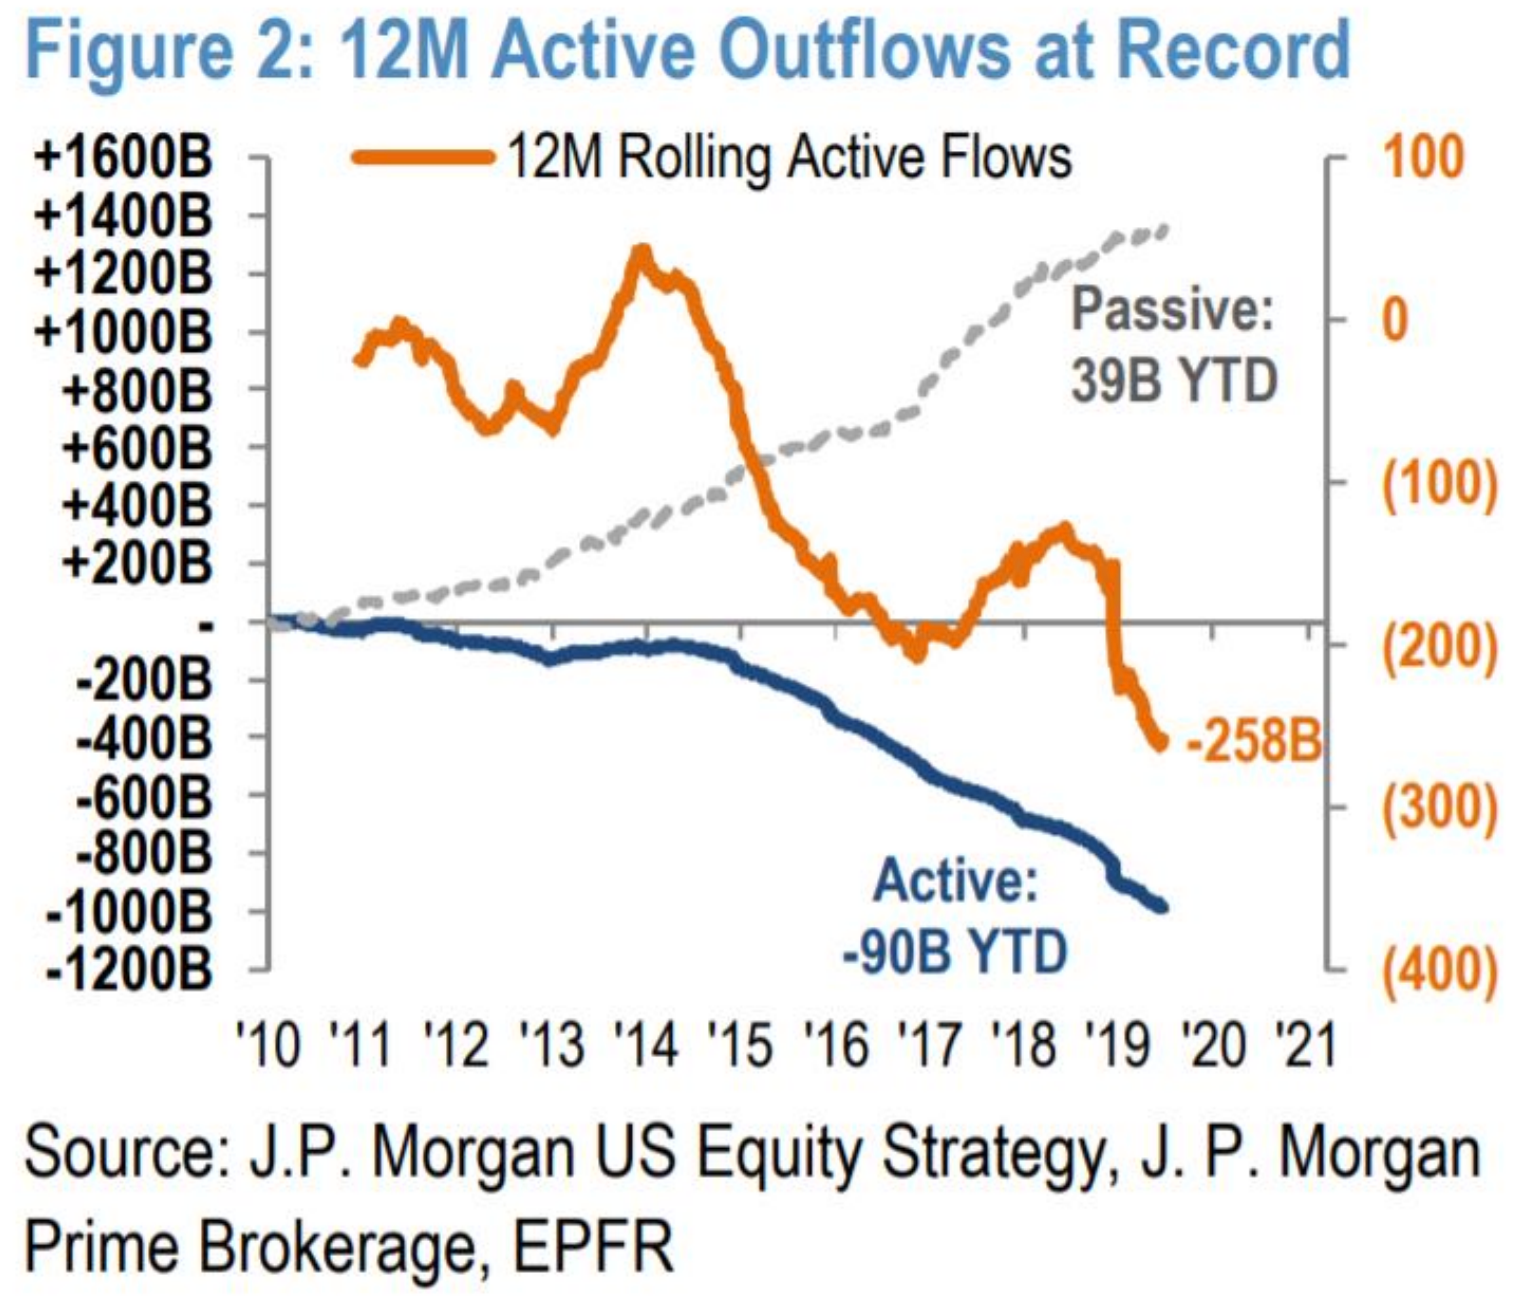
Theme 1-passive management fund flows continue to crush active management
So far this year, about $39 billion has shifted into passive funds and $90 billion has shifted out of active funds. Many think that 80 percent of the market is now on autopilot. Passive investments control about 60 percent of equity assets, while quantitative funds -- those relying on trend-following models instead of on fundamental research -- now account for 20 percent of market share, according to estimates from J.P. Morgan.
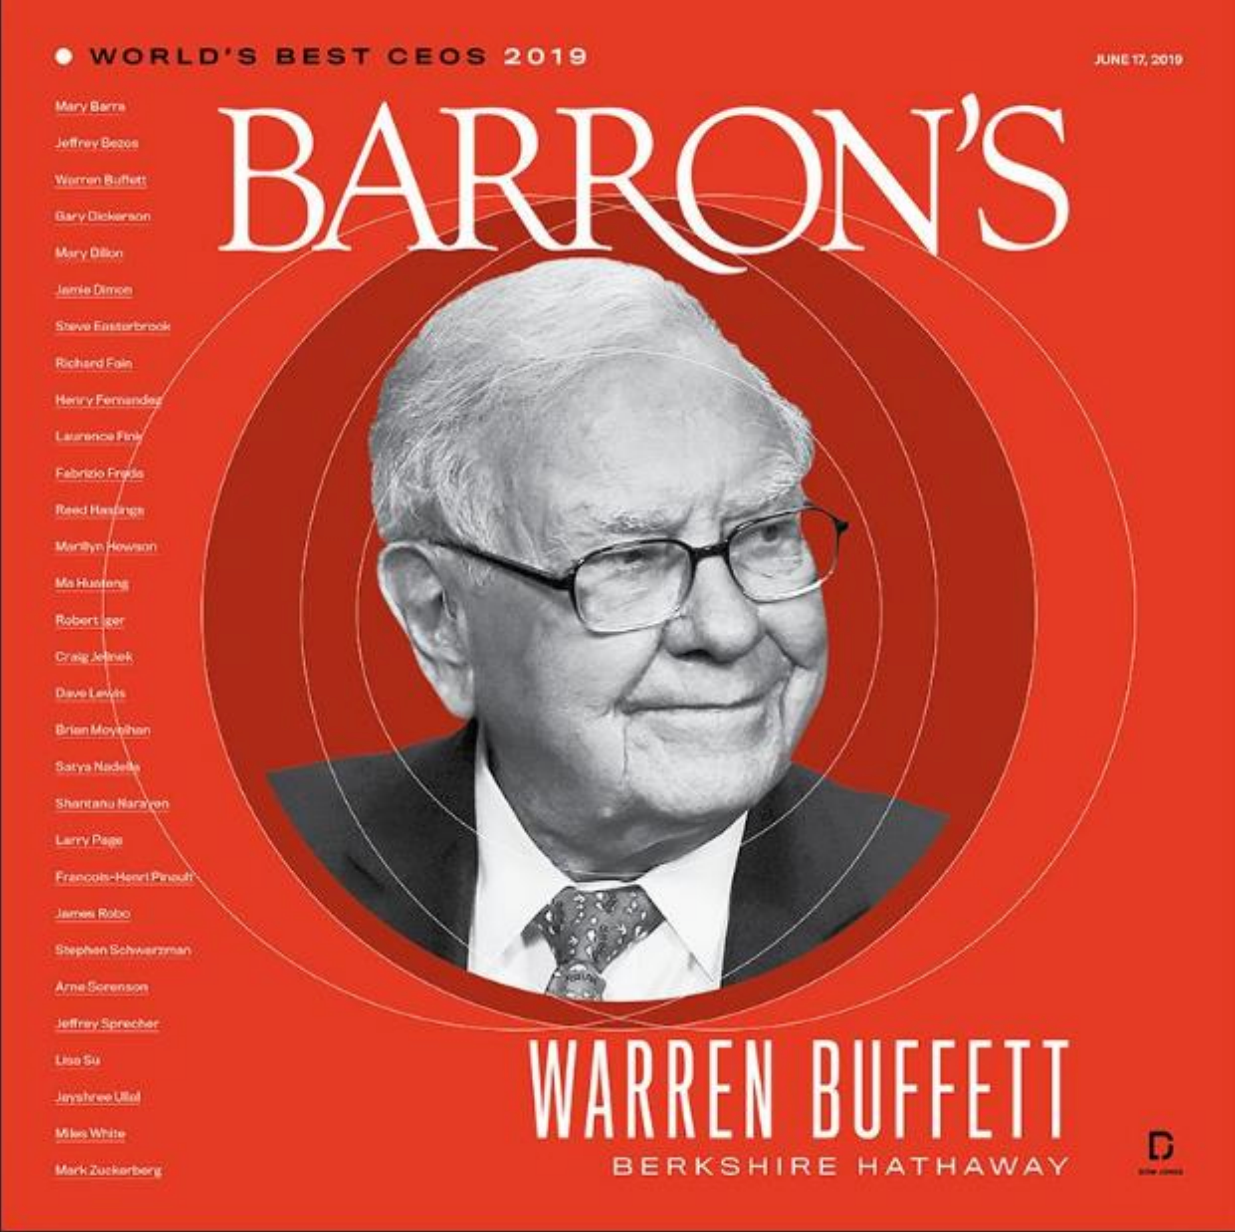
20 years later “The Big Guy” is back on the cover of Barron’s as “CEO of the Year.”
Theme 4-Demographics is destiny
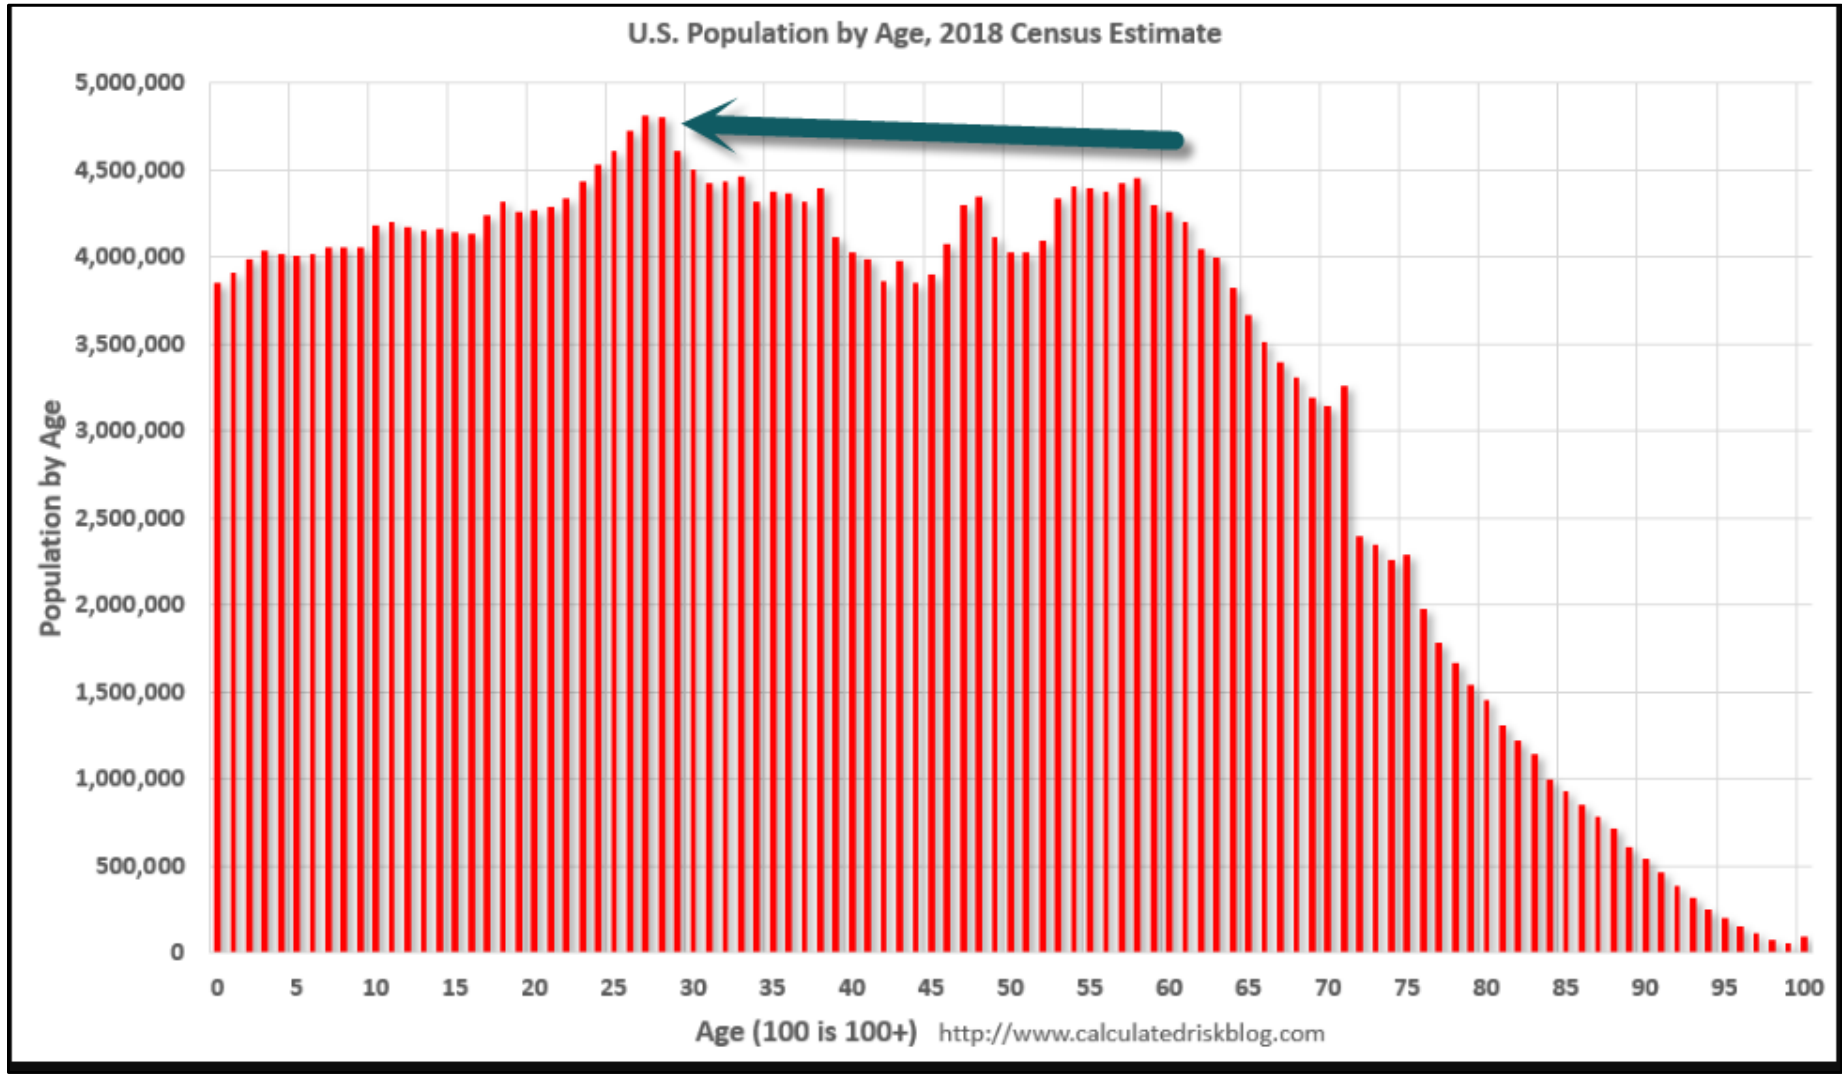
Speaking of Millennials, we tend to be passionate believers in the power of demographic trends. Consider these facts:
- By the year 2020, eight of the top ten demographic cohorts will be under age 40 (Boomers will be fading away).
- By the year 2030 the top 11 cohorts will be the youngest 11 cohorts.
There will be plenty of "gray hairs" walking around in 2020 and 2030, but the key for the economy is that the number of Americans in their prime working years is now increasing. If nothing else, this should be a positive trend for housing and the economy.

Yield curve update and global interest rates
As mentioned in last quarter’s letter, the yield curve inversion is not a timing mechanism, since the market historically performs pretty well another 12 to 18 months post-inversion. We also saw yields on the 10-year Treasury bond break below 2 percent in Q2 of this year—a time when $12 trillion of international bonds are trading at negative interest rates in the midst of a global move downward. That could be a massive amount of money essentially being parked in shoeboxes under investors’ beds!
Theme 3 -Growth investing is crushing value investing
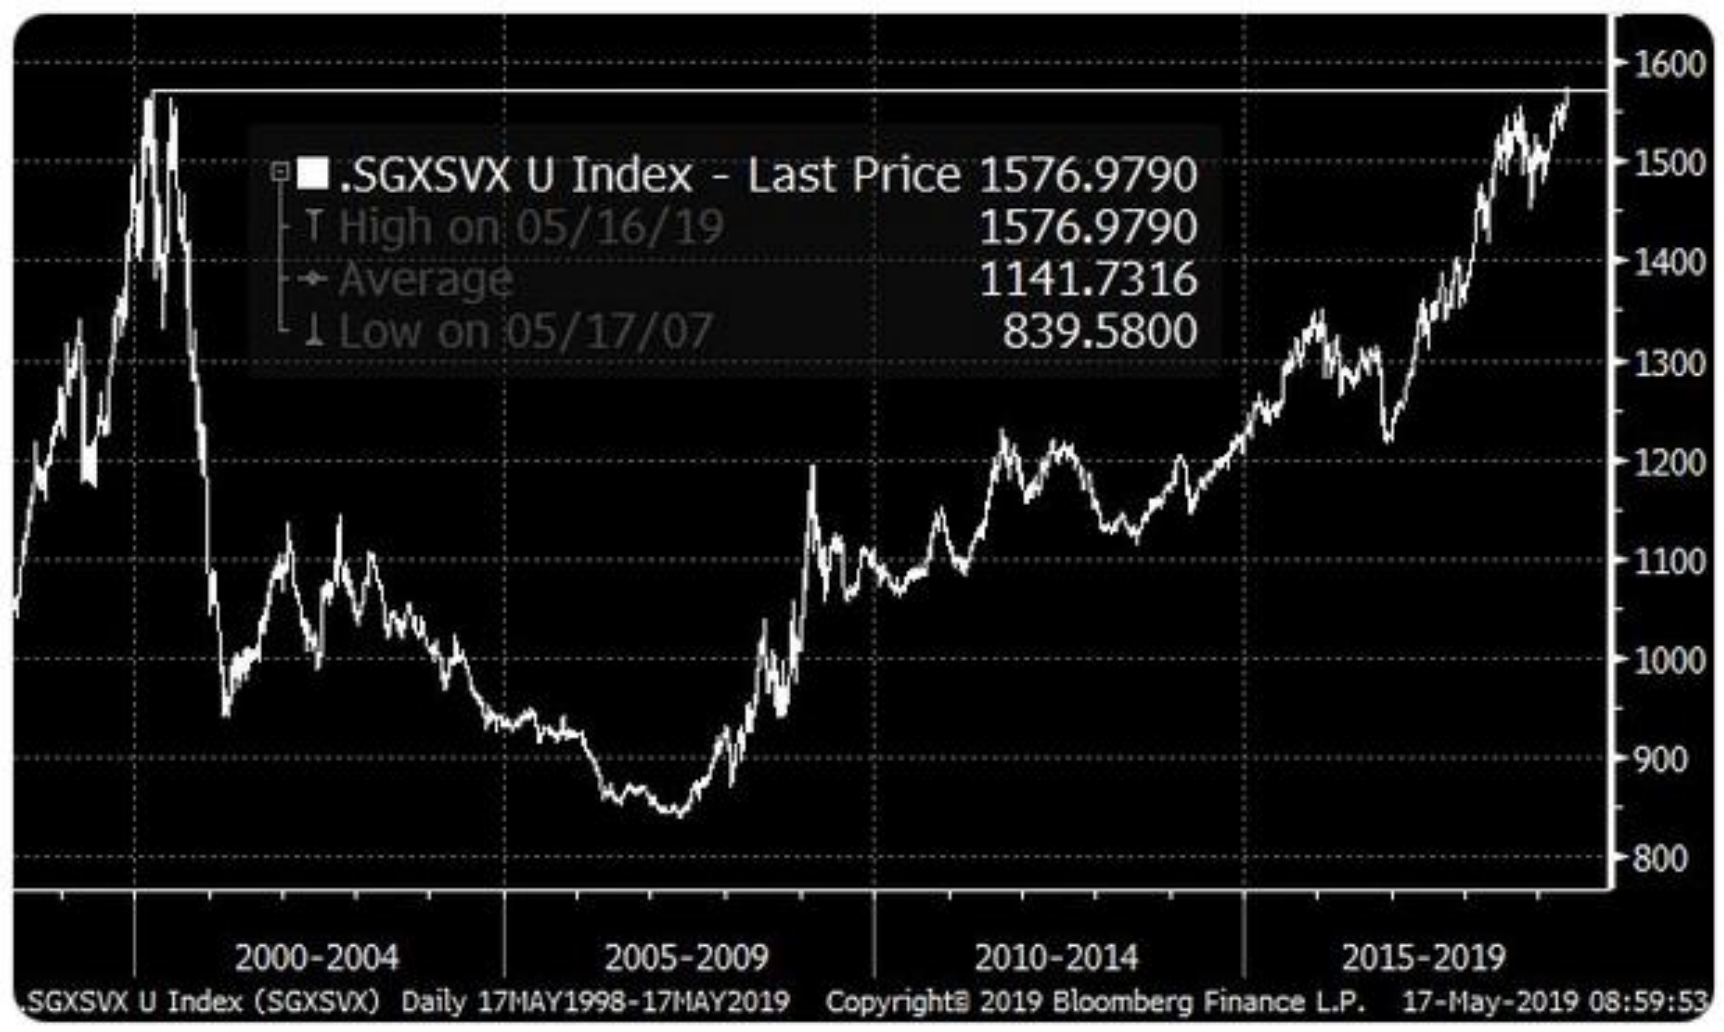
- S&P growth stock vs. value stock rallies above 1999 record spread
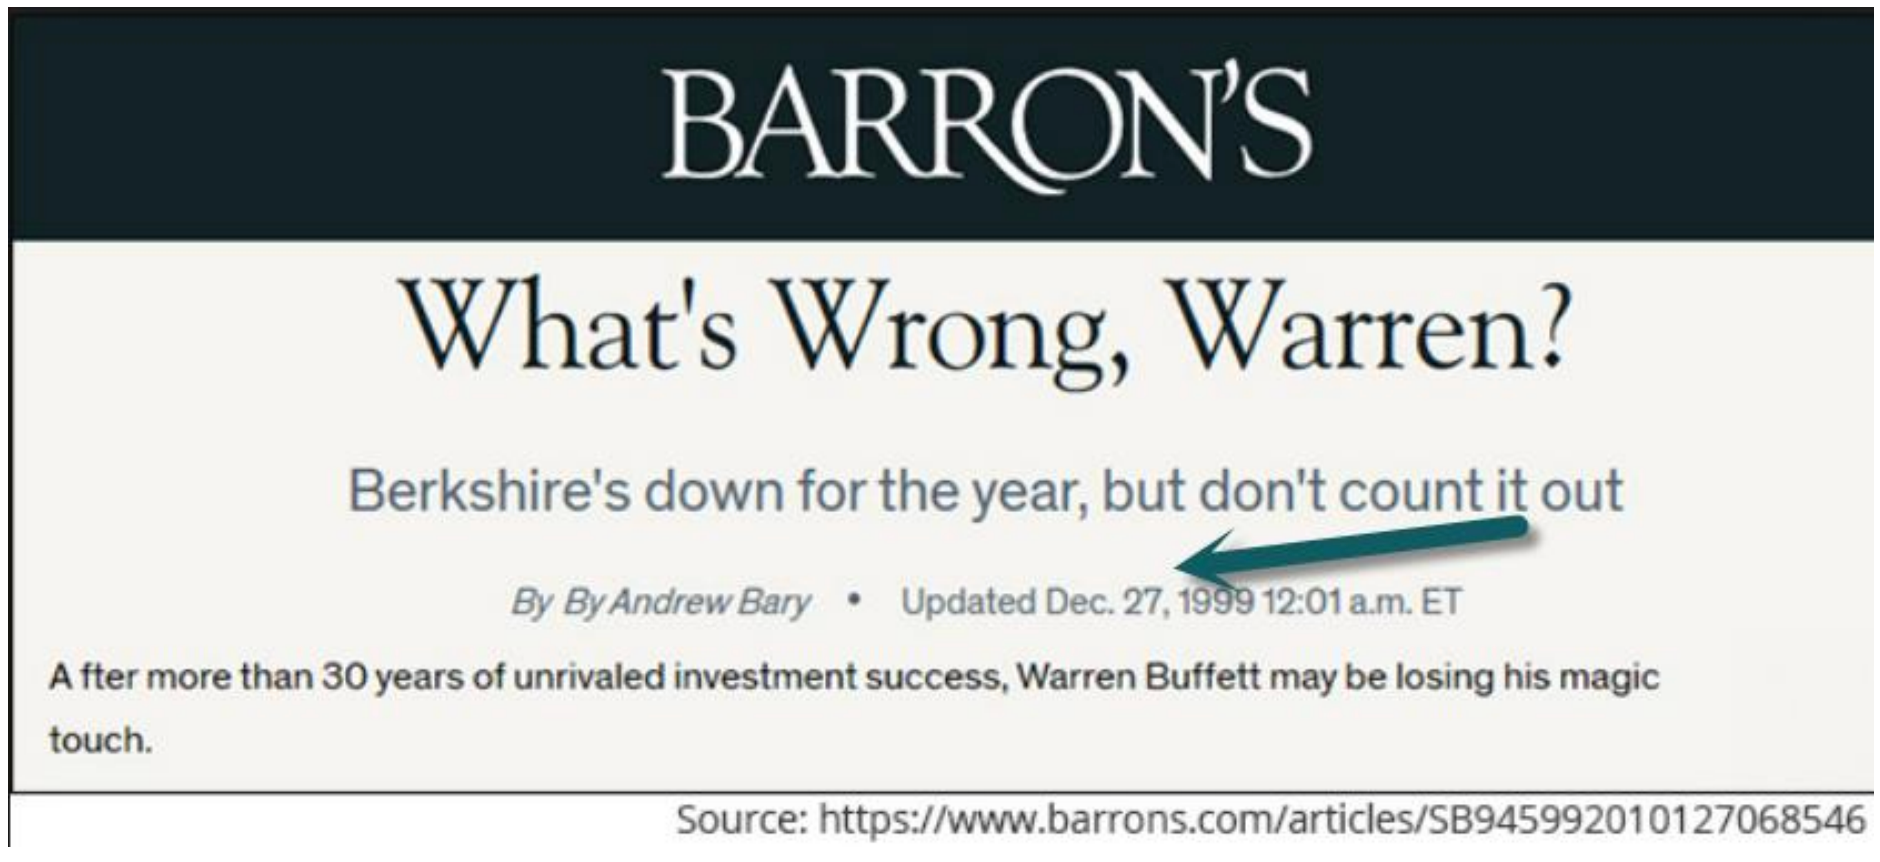
- I started my trading career in 1997 in the early innings of the Internet bubble. I never thought we would witness such a large spread between growth and value stocks again. I was wrong. Not only are we seeing a spread of historical proportions - but we are hearing many of the same themes that we heard in 1999. Twenty years ago, Goldman Sachs published an ill-timed piece about the death of value stocks and a Forbes article suggested for Warren Buffett should call it quits after 10 years of under-performance.

First crack in the bull market, but don’t get fooled again
Refer to last quarter’s letter for details about historical returns post-yield curve inversion. Again, the important piece of new data this quarter is that the inverted yield curve has remained inverted—it’s not a temporary blip.
Take a minute to review the chart below. How many Millennials are familiar with this chart? In my experience, Amazon means just two things to them--(1) that’s where they order almost everything in their lives and (2) the stock only goes up.
1999-2000 Nasdaq and Amazon chart.
Another eye-catching statistic is that the performance spread between growth stocks and value stocks is at its fourth highest level in a century.
As BlackRock’s Andrew Angle noted,
“The value drawdown that started at the beginning of 2017 is one of the worst investors have faced.”
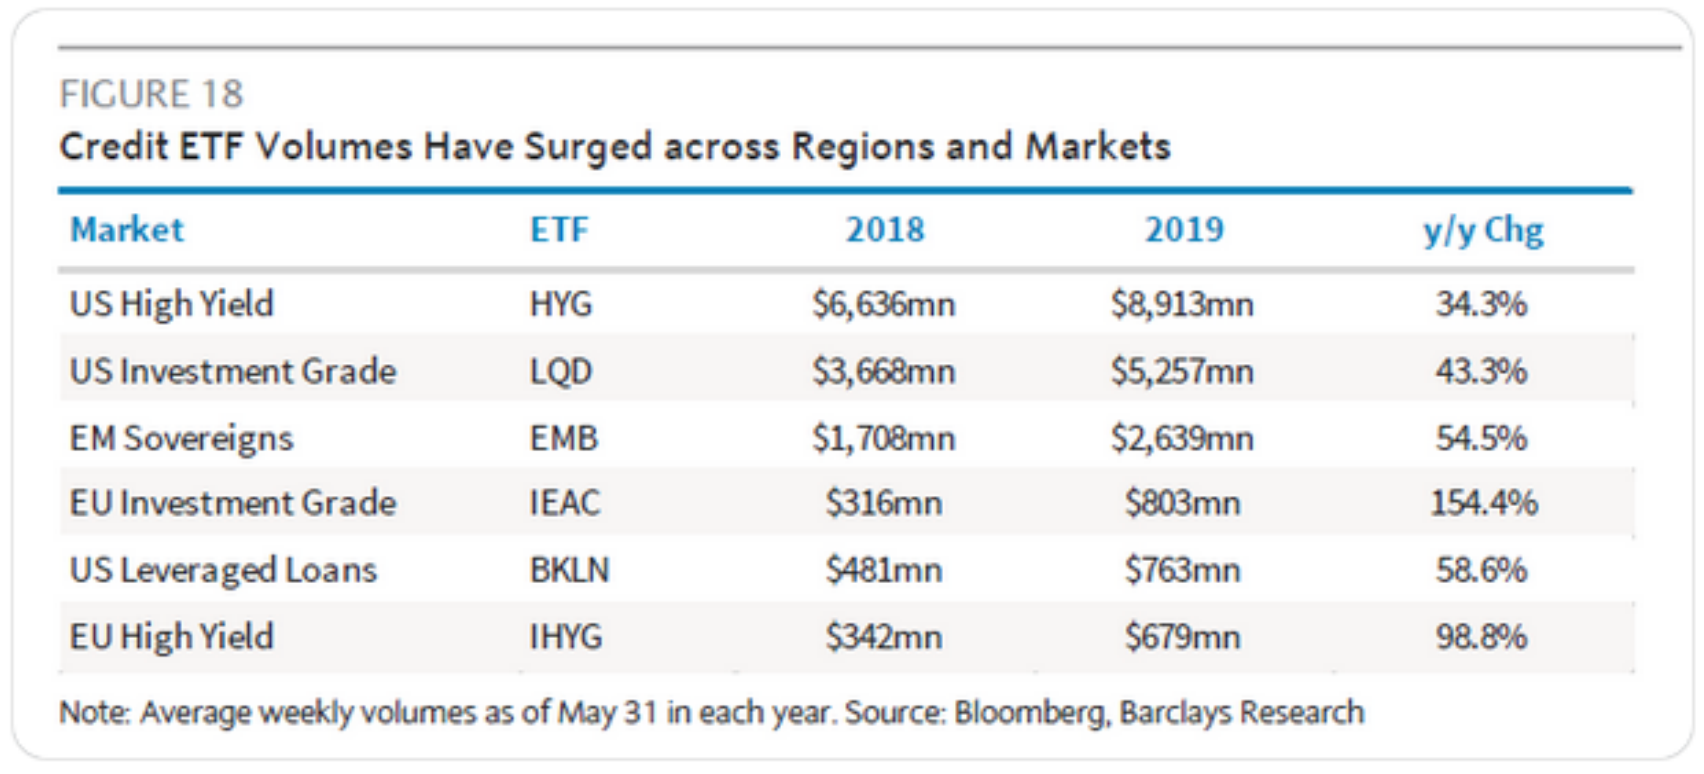
As shown above, bond ETFs are booming. According to Dave Lutz (Jones Trading), essentially every category has recorded double-digit growth in average weekly volumes between last year and 2019.
With the inverted yield curve being in place as the first serious sign of a recession in the near future, could the American investing public be right? After hundreds of years of market flows proving the American public and professional investors as horrific market timers, could this time be different?
As I discussed in my Q1 letter, it’s important to be sure that an inverted yield curve is not just a temporary anomaly:
“First, it’s important to remember that not everyone uses the same definition of ’inversion.’ Like the San Francisco Fed, I consider an inversion to be a situation in which the yield on 3-month Treasuries is higher than the yield on 10-year Treasuries. According to the Cleveland Fed, inversions of that 3-month/10-year spread have preceded each of the past seven recessions, including the 2007-2009 contraction. The Cleveland Fed acknowledged there have been two ‘false positives’ — an inversion in late 1966 and a ’very flat’ curve in late 1998.
Bond ETFs double assets in one year
Why aren’t oil prices spiking—another key recession indicator?
Most finance textbooks and market historians argue that recessions are caused by the Fed raising rates and/or oil prices spiking. As Moody’s chief economist Mark Zandi told CNBC, “Quickly rising oil prices have been a contributing factor to every recession since World War II.”
The first 17 years of my finance career were spent on a trading desk. If you ever had a situation in which Iran attacked oil tankers in the Strait of Hormuz and shot down a U.S. military drone in the same month, you can bet your butt that oil prices would skyrocket! But today it’s different. Sure, Iran’s recent actions put us on the brink of a hostile U.S. military response, but the price of oil barely budged. Further, the oil volatility index was rolling over just a few days later. Which is hard to believe!
It’s almost unthinkable that President Trump was within hours of a military response against Iran and oil only moved 2 percent higher. But the next several charts help explain why:
Ed Yardeni
https:/www.linkedin.com/in/edward-yardeni/
As domestic oil supply expanded to the point that the U.S. become a net oil exporter, our reliance on Persian Gulf crude evaporated. In late June, President Trump said the U.S. may lessen its role in the Strait of Hormuz as domestic oil and gas output grows and our energy imports from the Middle East decline.
Combine massive oil supply and demand changes with climate change and shifting attitudes toward clean energy technology and you have an impetus for massive economic transformation in the Middle East. United States imports of Persian Gulf crude are down by nearly 70 percent over the 10 years. As a result, a number of Middle Eastern countries will need to adjust their economies substantially.
“The pace of outflows from active is at a cycle high while the pace of passive equity inflows has bottomed and [is] beginning to reaccelerate,” Dubravko Lakos-Bujas, J.P. Morgan’s chief U.S. equity strategist, said in a note on late in June.
Theme 2-Large -cap growth stocks and S&P 500 stocks continues to dominate performance
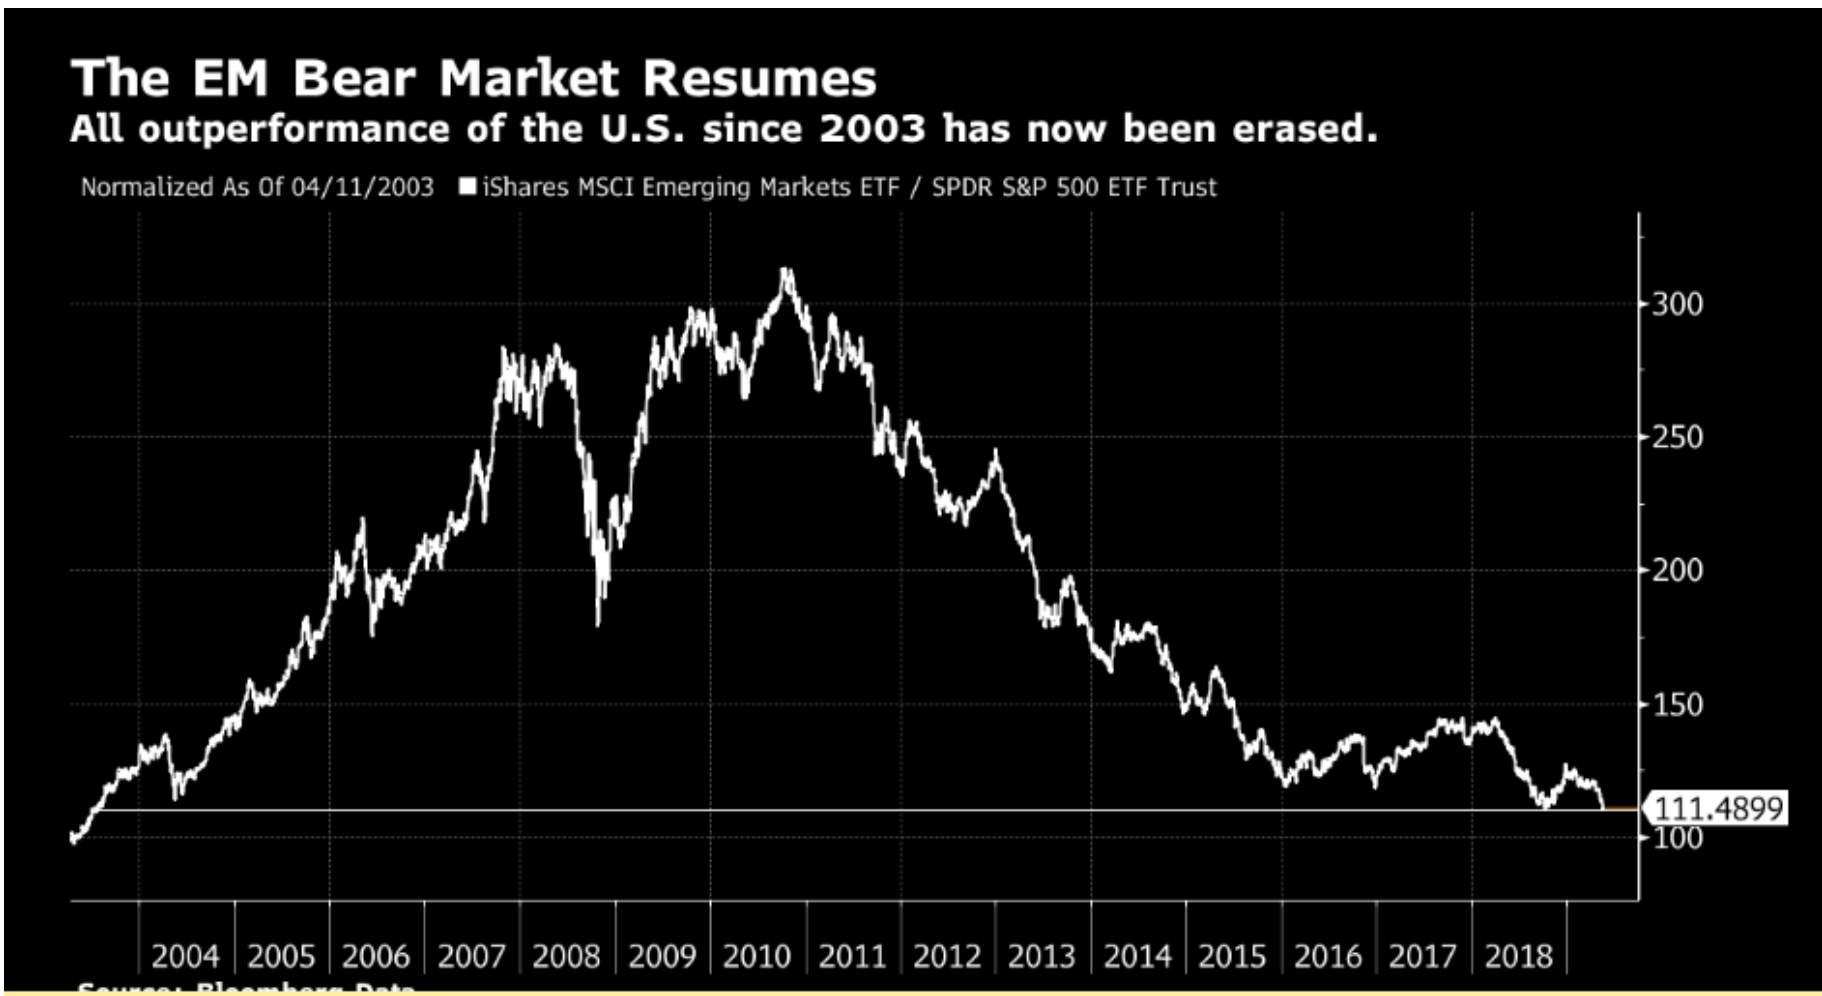
In past letters I have talked about the widening spread in performance and valuations between large cap U.S. stocks and international markets. Large cap growth stocks now trade at close to 9x price to book (P/B) value compared to 1.5x P/B for emerging market stocks and 2.5x P/B for developed market stocks.
The entire outperformance of emerging market stocks since 2003 has been
erased
This might explain why the sell-off at the end of last year functioned as a correction to drawn-out U.S. outperformance, while this latest moment has seen emerging markets lag behind the S&P 500 even more. At this point, all the outperformance by emerging markets since 2003 has been canceled out – an extraordinary statistic given the speed of growth in much of the emerging world.
(placeholder Vanguard growth vs. EEM emerging markets 5 year)

U.S. Demographics: Largest 5-year cohorts, and Ten most Common Ages in 2018
Final thoughts: Prepare for the years ahead
I’d like to reiterate the advice from my Q1 letter:
- Stick to your plan. Investing is a psychology game, not an IQ game. Do not get emotional, have a plan.
- Prepare for lower but acceptable returns.
- Mentally prepare for a recession size drawdown in equities, possibly 30-40%
- Get aggressive when stocks are on sale.
Longest Economic Expansion Since WWII.
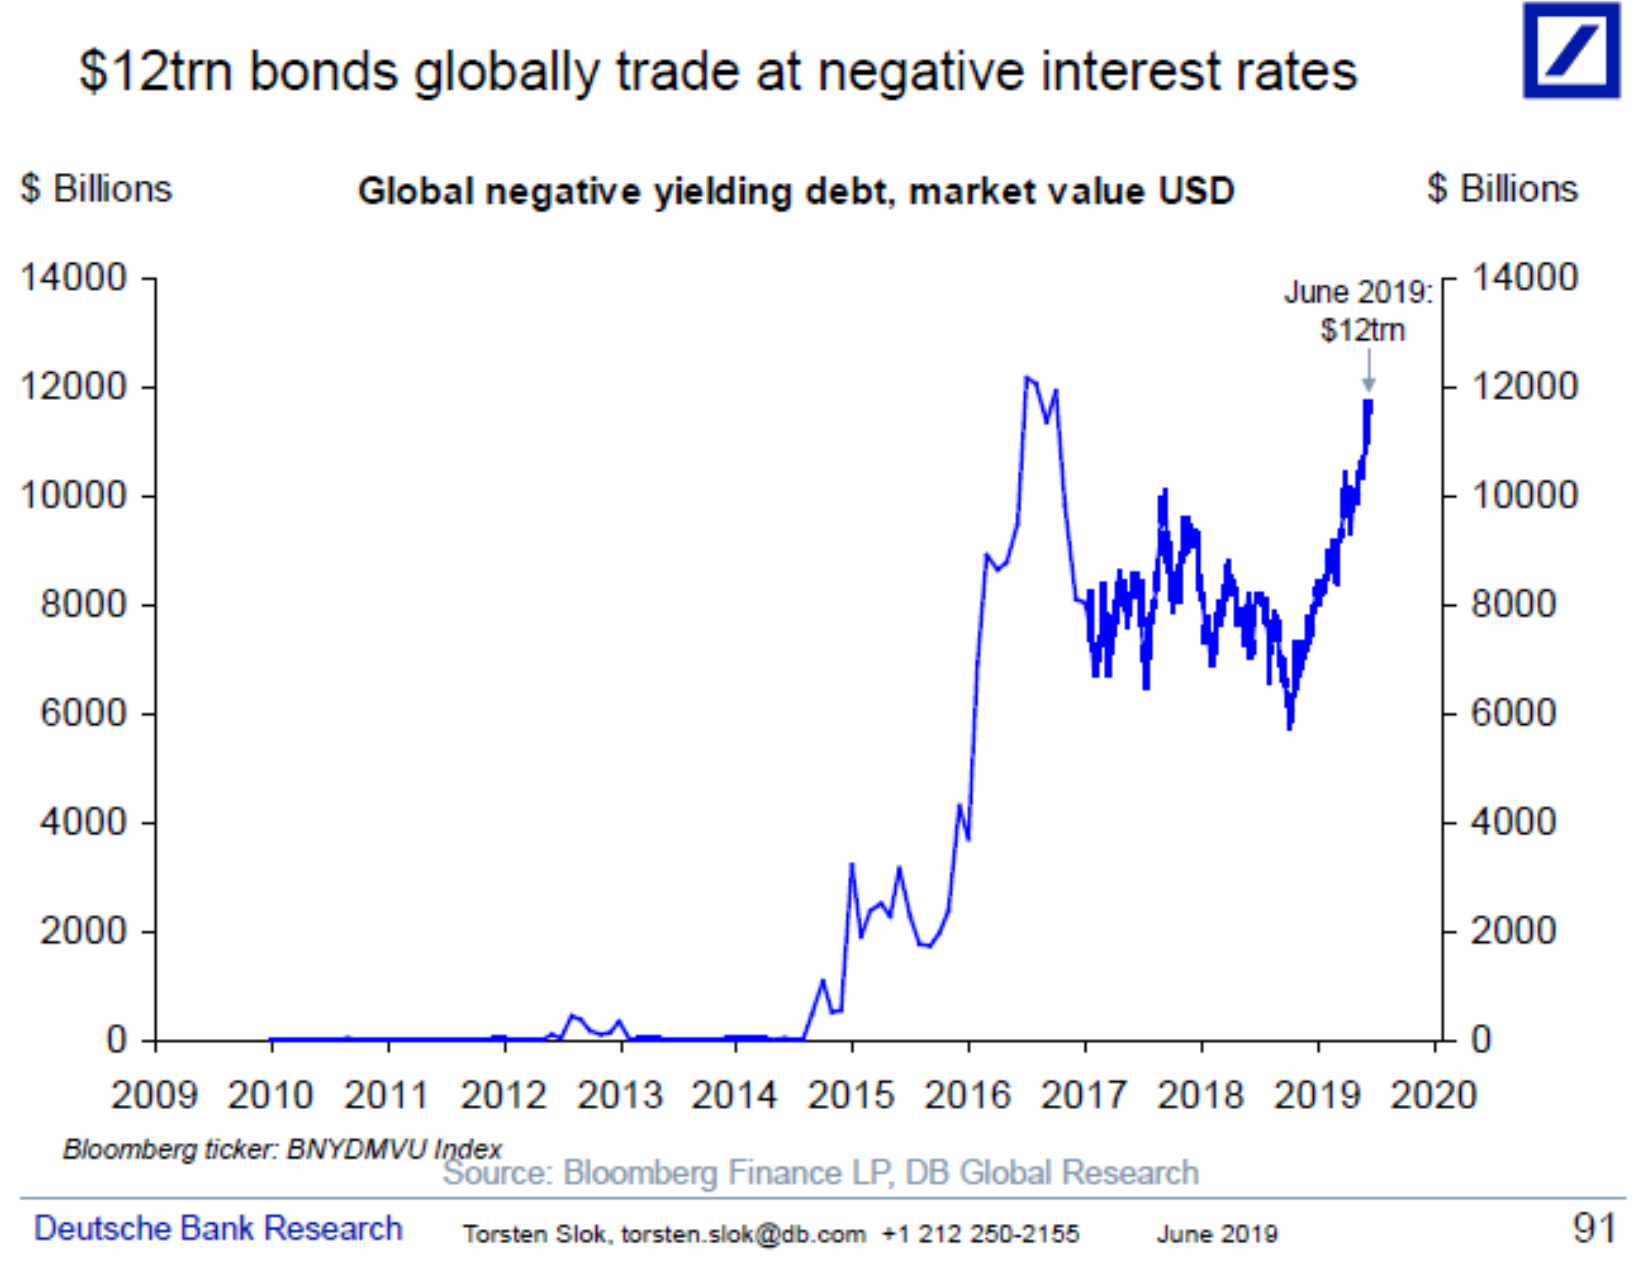
Source : Torsten Sløk, Ph.D.Chief Economist Managing Director Deutsche Bank Securities
Everyone is talking about the end of the long-running bull market in U.S. equities, but in the second quarter of 2019, the most crowded trade in the world became U.S. Treasuries. Even though rates are abnormally low, the Fed Funds futures market is now signaling a 100 percent chance that the central bank coule ease its monetary policy next month. Incredible!
Here are some excerpts of the notes coming across my radar recently:
For the first time ever, being long US Treasuries was considered the most-crowded trade according to the June global fund manager survey conducted by Bank of America Merrill Lynch .
The bet on government bonds beat out popular crowded trades such as tech, high-quality and emerging markets, each of which has occupied the list's top spot since 2013.
The study was released Tuesday during a week in which traders were watching multiple events that could set the course for global growth going forward: the Federal Reserve meeting Wednesday, and the G20 summit later in the month.
Historically, when equity bull markets end money pours almost exclusively into stocks. But today, we have seen government bonds beat tech stocks as the most crowed trade in the market and bond ETF assets have doubled over the past year alone. I don’t know anyone who is bulled up on stocks--, it’s the single biggest anomaly I have witnessed in my 20-plus year career in finance. As mentioned in previous letters, the Great Recession of 2008-09 caused the massive equities risk hangover we haven’t seen since the Great Depression of 1929.
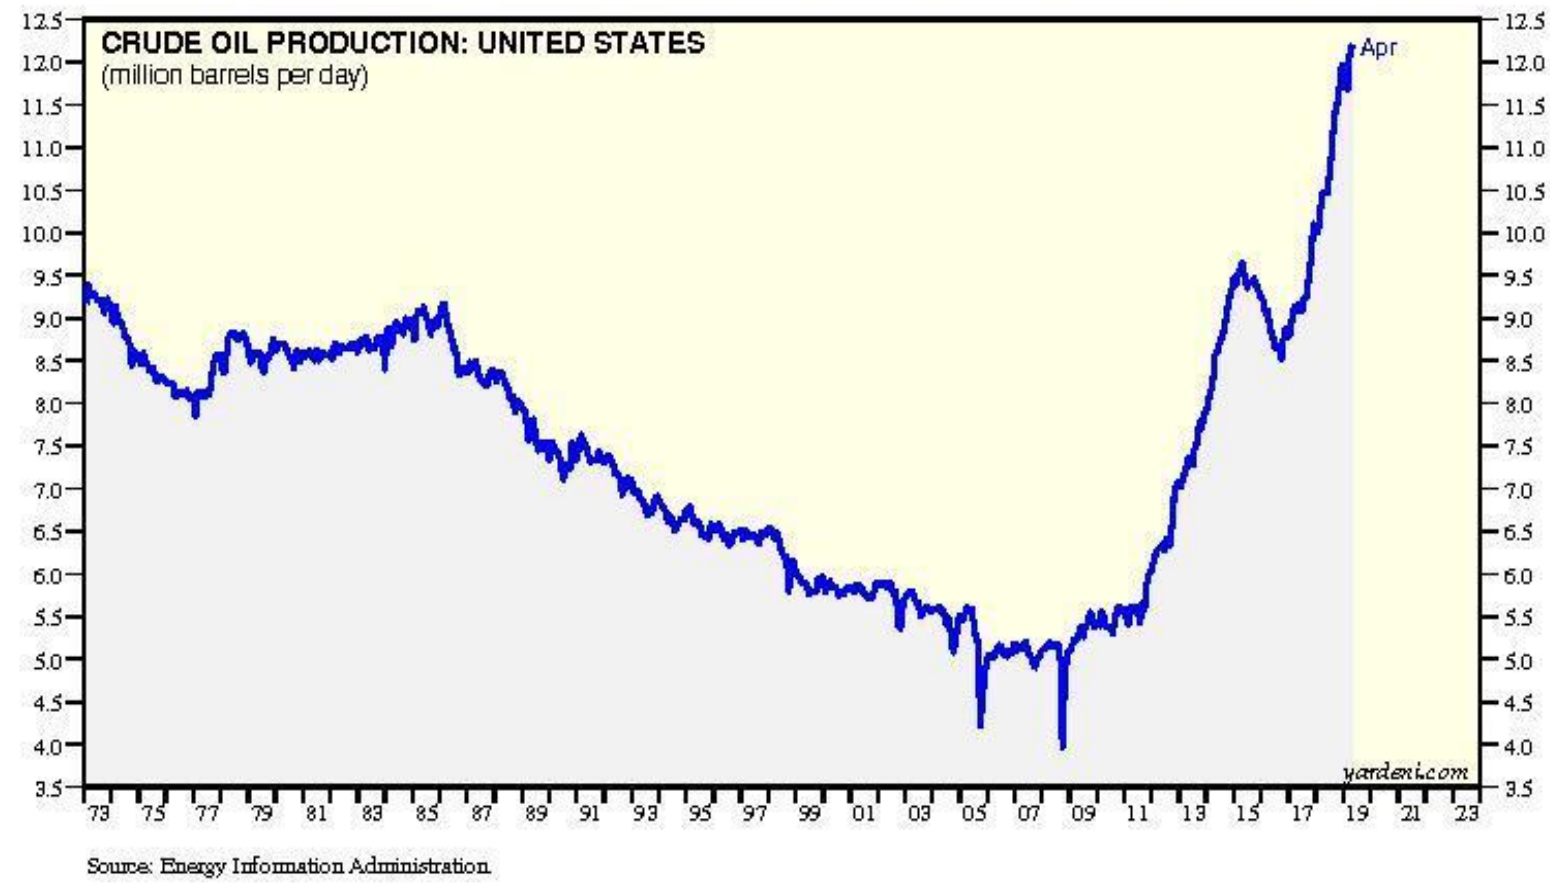
Crude oil production exploded after the 2008 Great Recession
On December 7th, 1999, Barron’s published the infamous “What’s Wrong,Warren” cover eerily before the Nasdaq crashed 50% and Berkshire recovered years’ worth of underperformance.
The below graph plots the time period 6/30/98 through 2/29/00 for the Nasdaq where many dot-com and technology stocks traded, and the price of Berkshire Hathaway, Warren Buffett’s holding company, which consisted of value stocks:
S&P 500 Growth vs Value gets over the 2000 peak, twits notes.
by Calculated Risk on 6/11/2019 11:59:00 AM
Read more at https://www.calculatedriskblog.com/2019/06/us-demographics-largest-5-yearcohorts.html#4HqAHczSfKOOKJIr.99
As shown above, the U.S. has the largest demographic group in history hitting its prime spending years. That makes me believe the next recession--like all previous economic slowdowns--will present great buying opportunity for stock investors. But make no mistake - I believe we will have a recession before reaping the full benefits of Millennial spending power. If you doubt this macro trend, just scan some of the charts about student loan growth and urban apartment expansion. The “pig through the python” is coming and it may have a profound impact on our economy over the next two decades. There will be more on this trend in a future letter focused on demographics.
Beyond U.S. demographics, we have global population projections predicting the rise of Africa as Asian hyper-growth rolls over.
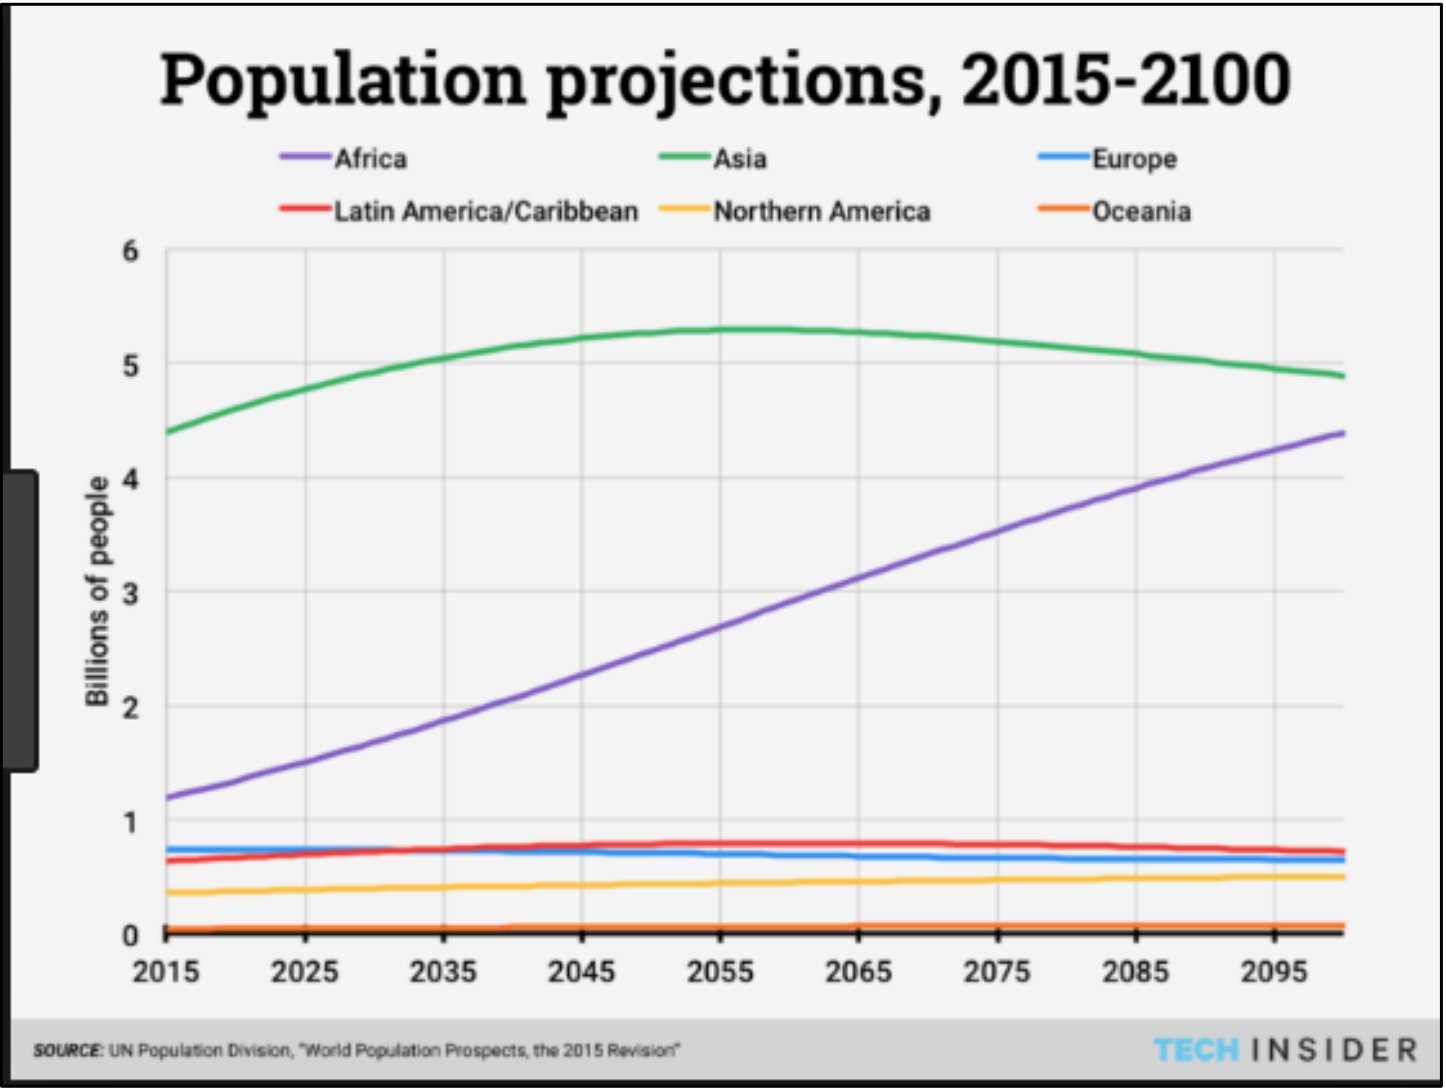
Future Population Growth.
Conclusion
After being historically bullish about stock pullbacks--including hosting a webinar at the beginning of this year [LINK] that the end of 2018 was a buying opportunity, not the start of recession, I believe we are now in a more precarious situation. The inverted yield curve should not be ignored, and our economy appears to be running out of qualified workers as the jobless rate settles below 4 percent. Amazingly we have not experienced inflation despite such a historically low unemployment rate, so the stock market continues to rise.
Sure, stocks are on the pricey side, but I don’t believe it means the market is on the brink of crashing. I wouldn’t consider this to be a bubble when you consider how low interest rates and low inflation are.
Now is not the time to give up on a diversified portfolio. The S&P is expensive versus other options and we should temper our expectations for equity returns over the next half decade as stocks will likely face new headwinds.