Introduction
If you recognize this song give yourself an A for 80’s Music 101; if you are familiar with the picture of the lead singer, then you spent more time in your bedroom watching MTV than your children spend on their iPhones.
The excellent Netflix documentary “Betting on Zero” serves as a cautionary tale of the investment risk of, well...betting on zero. The film chronicles legendary investor Bill Ackman’s failed attempt to prove Herbalife is a pyramid scheme and that the stock price would drop to zero. After five years and almost $1 BILLION in losses, Ackman surrendered.
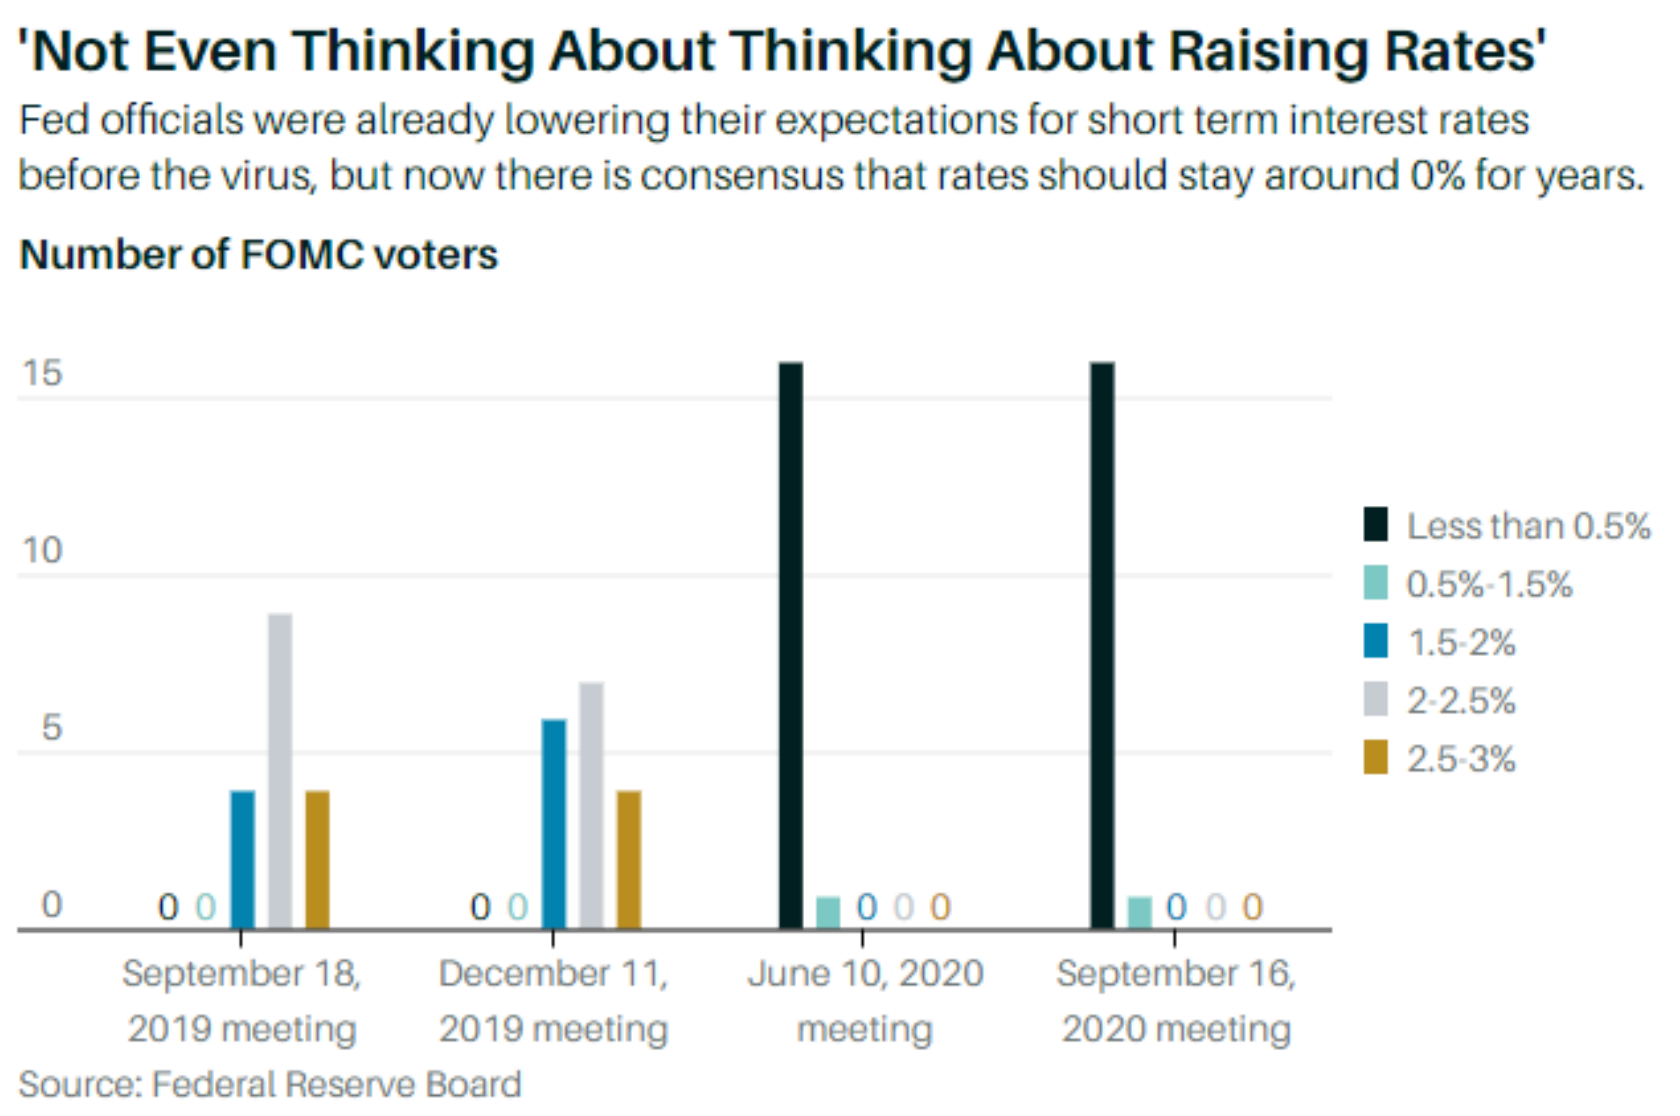
Today, for the economy and the markets, it’s the Fed betting on zero interest rates (Chairman Powell: “We’re not even thinking about thinking about raising rates.”) in an effort to spur economic growth as well as provide support for higher equity prices. And much like Ackman, many prognosticators will bet against the Fed in favor of shorting perceived bubbles and betting on runaway inflation. Yet these same traders have been annihilated for decades as they’ve watched inflation tamed by oversupply of oil, technological innovation, and cheap labor.
This time around we have a rare Fed consensus on zero percent interest rates “for some time.” The coronavirus has forced the seven Fed governors to go all in—betting on zero and leaving investors with no choice but to abandon bonds in exchange for the risk/reward of equities. FOMO, Fear Of Missing Out, is driving the stock market higher.
Right? Maybe or maybe not?
Barrons
—“The Fed said that it ‘expects it will be appropriate’ to keep short-term interest rates near zero until three conditions are met: The job market has fully healed, inflation has returned to the target rate, and inflation ‘is on track to moderately exceed’ the target rate ‘for some time.’”
Saved by Zero-1980’s
Song by The Fixx
So maybe I'll win (saved by zero)
Maybe I'll win (saved by zero)
Maybe I'll win (saved by zero)
Who needs to win (saved by zero)
Saved by, saved by, save-saved by zero
Saved by, saved by, save-saved by zero
Saved by, saved by, save-saved by zero (saved by zero)
Saved by, saved by, save-saved by zero
Saved by, saved by, save-saved by zero
Saved by zero (saved by, saved by, save-saved by zero)
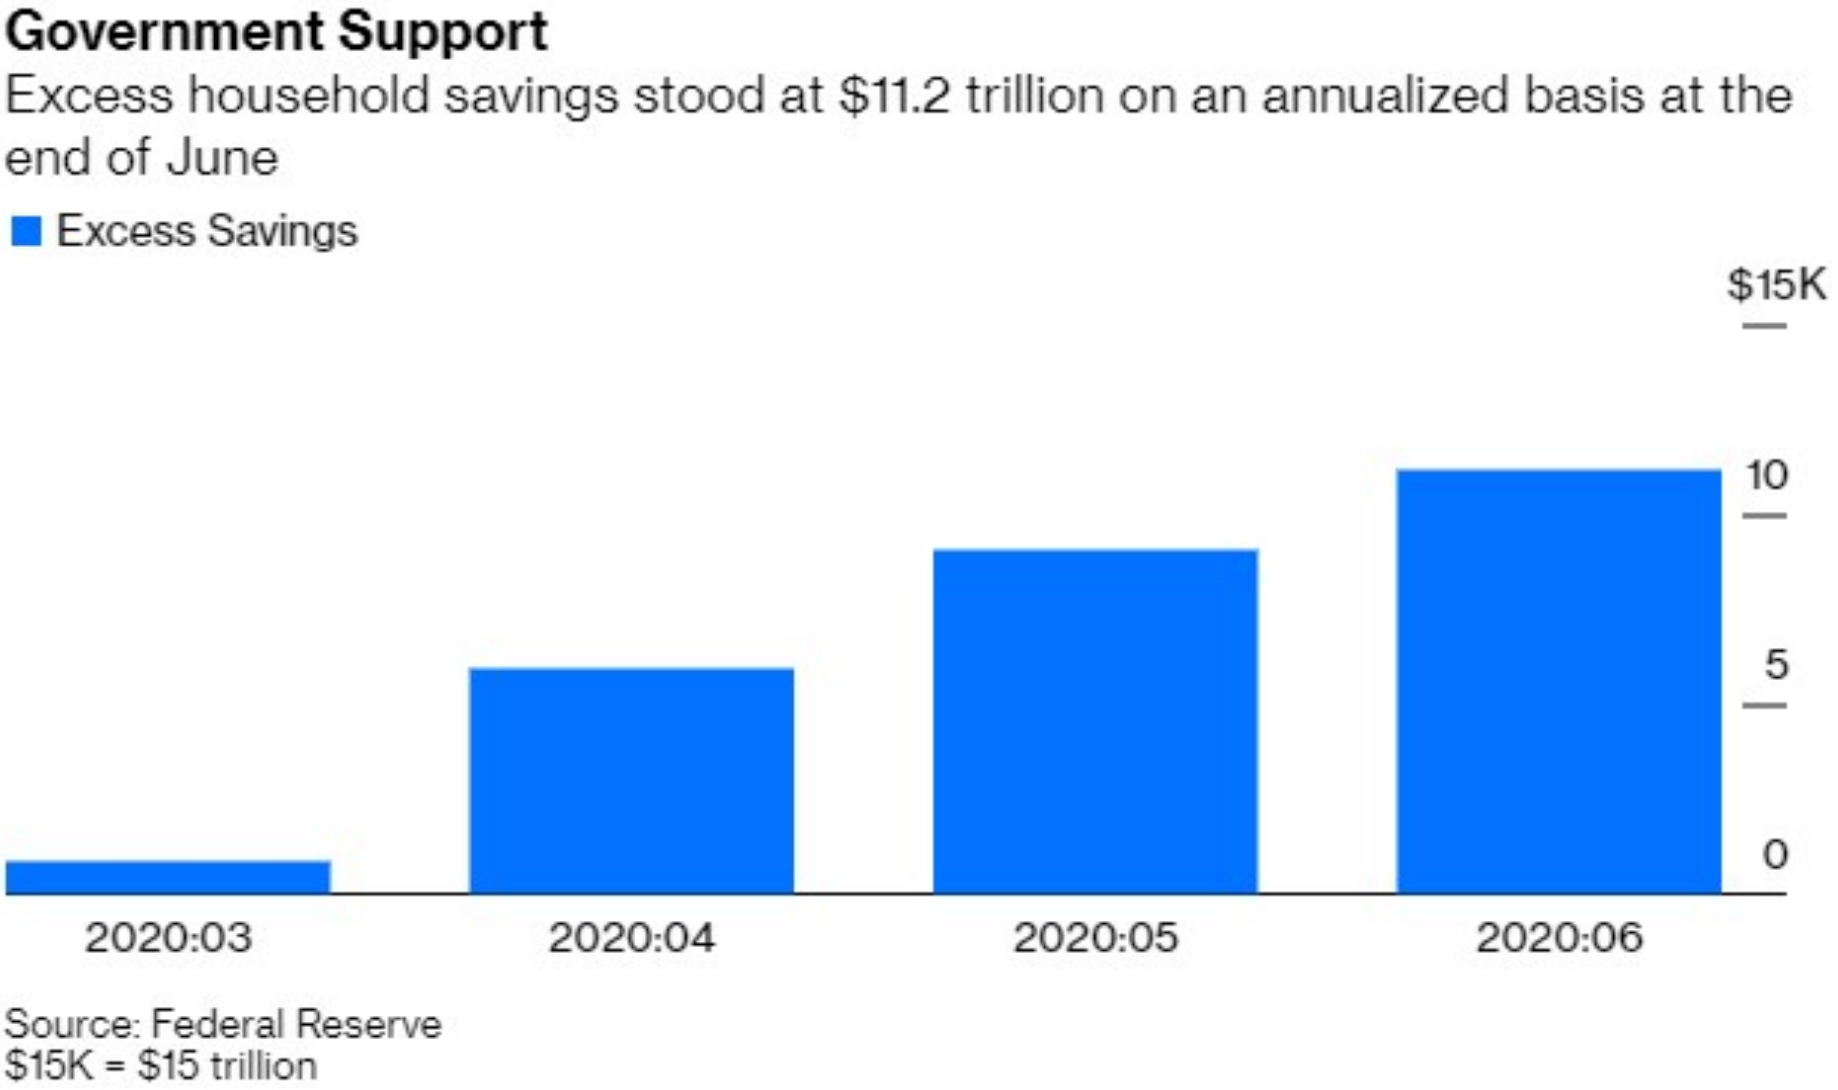
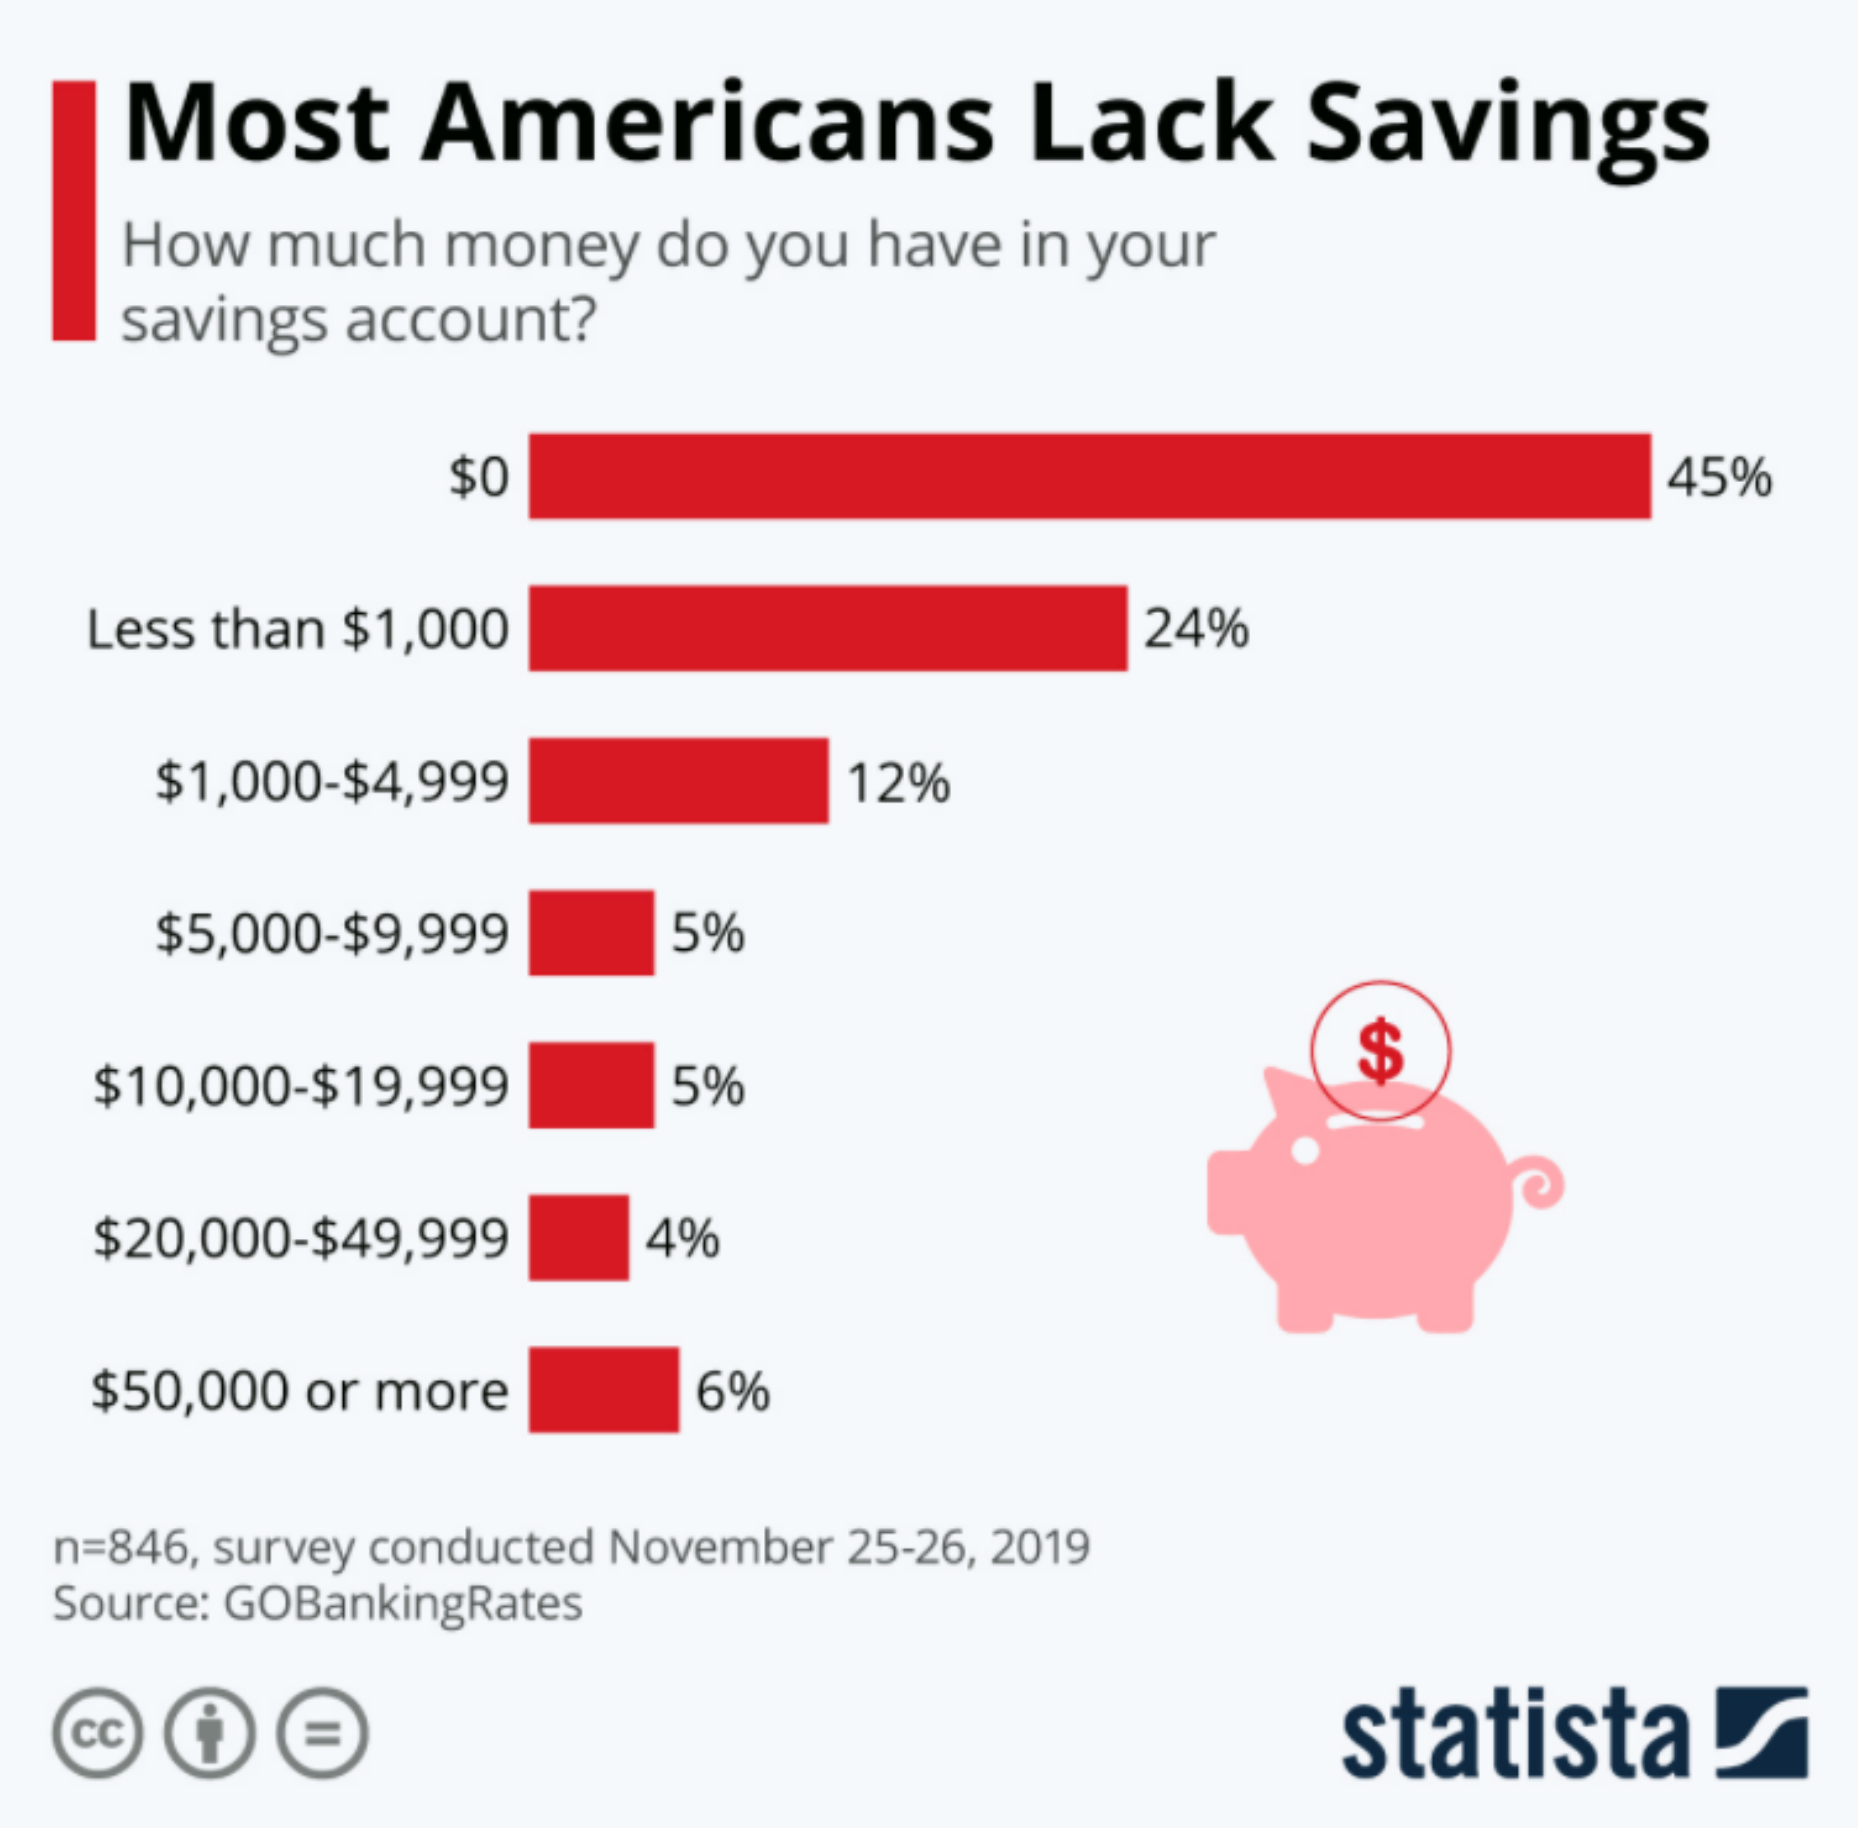
This combination of excess savings, reduced debt and government largesse has left household savings levels at $11 Trillion. This leaves us with 2 giant questions to ponder - especially in the middle of election season. Where will all this excess savings land post-election? How does the government deal with the bifurcated social class situation in America that is exacerbated every time interest rates go lower? At the same time that middle-class Americans are adopting the thrift of the WWII generation, the other half of the United State has less than $1000 dollars in savings.
Most investors are “waiting until after elections”, “keeping dry powder”, “waiting for a crash”, or “trading around the election”. John Bogle, legendary founder of Vanguard, is known for saying no one he ever saw on Wall Street could correctly predict these short-term events. Can the stock market crash with $11 trillion of cash waiting to be deployed post virus? If we get a vaccine, how does the economy respond to massive unleashing of pent-up demand? Furthermore, the new normal being a reduction in commuting costs could equate to a 2-5% raise in take home pay for a large part of population.
Excess Household Savings $11 Trillion at the End of June
Tim Duy at Bloomberg broke down the numbers on this and they are staggering:
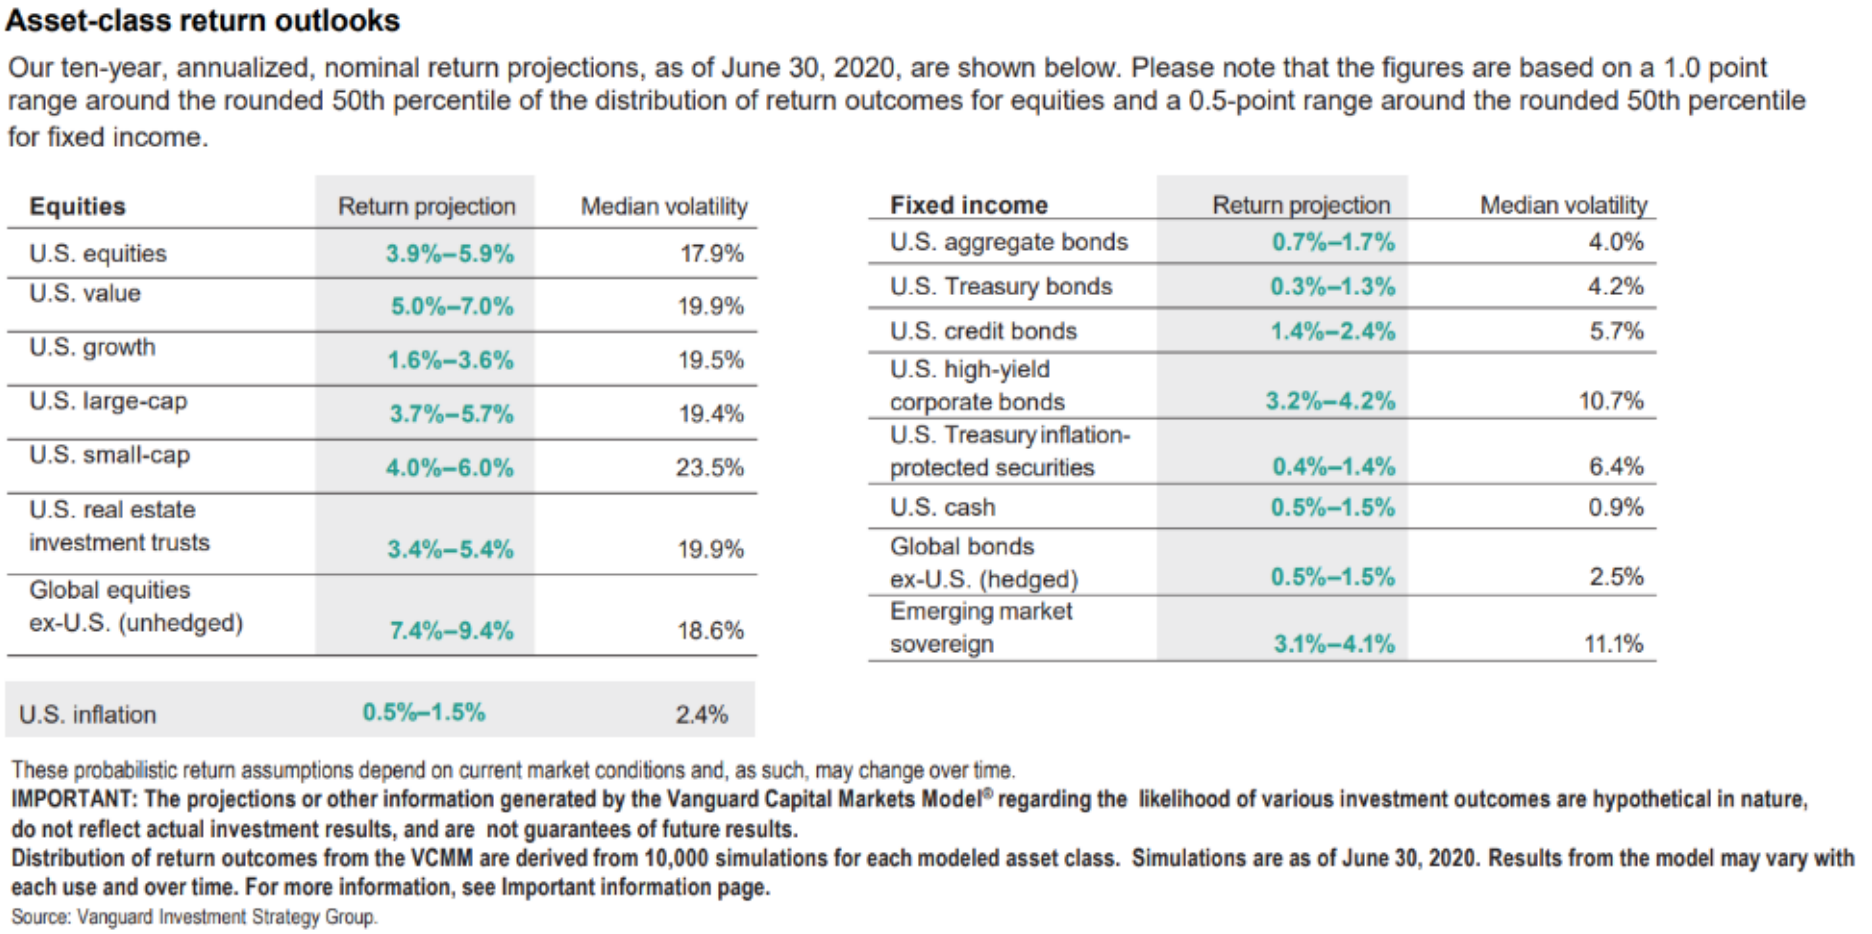
These probabilistic return assumptions depend on current market conditions and, as such, may change over time.
IMPORTANT: The projections and other information generated by the Vanguard Capital Markets Model regarding the likelihood of various investment outcomes are hypothetical in nature, do not reflect actual investment results, and are not guarantees of future results. Distribution of return outcomes from the VCMM are derived from 10,000 simulations for each modeled asset class. Simulations are as of March 31, 2019. Results from the model may vary with each use and over time.
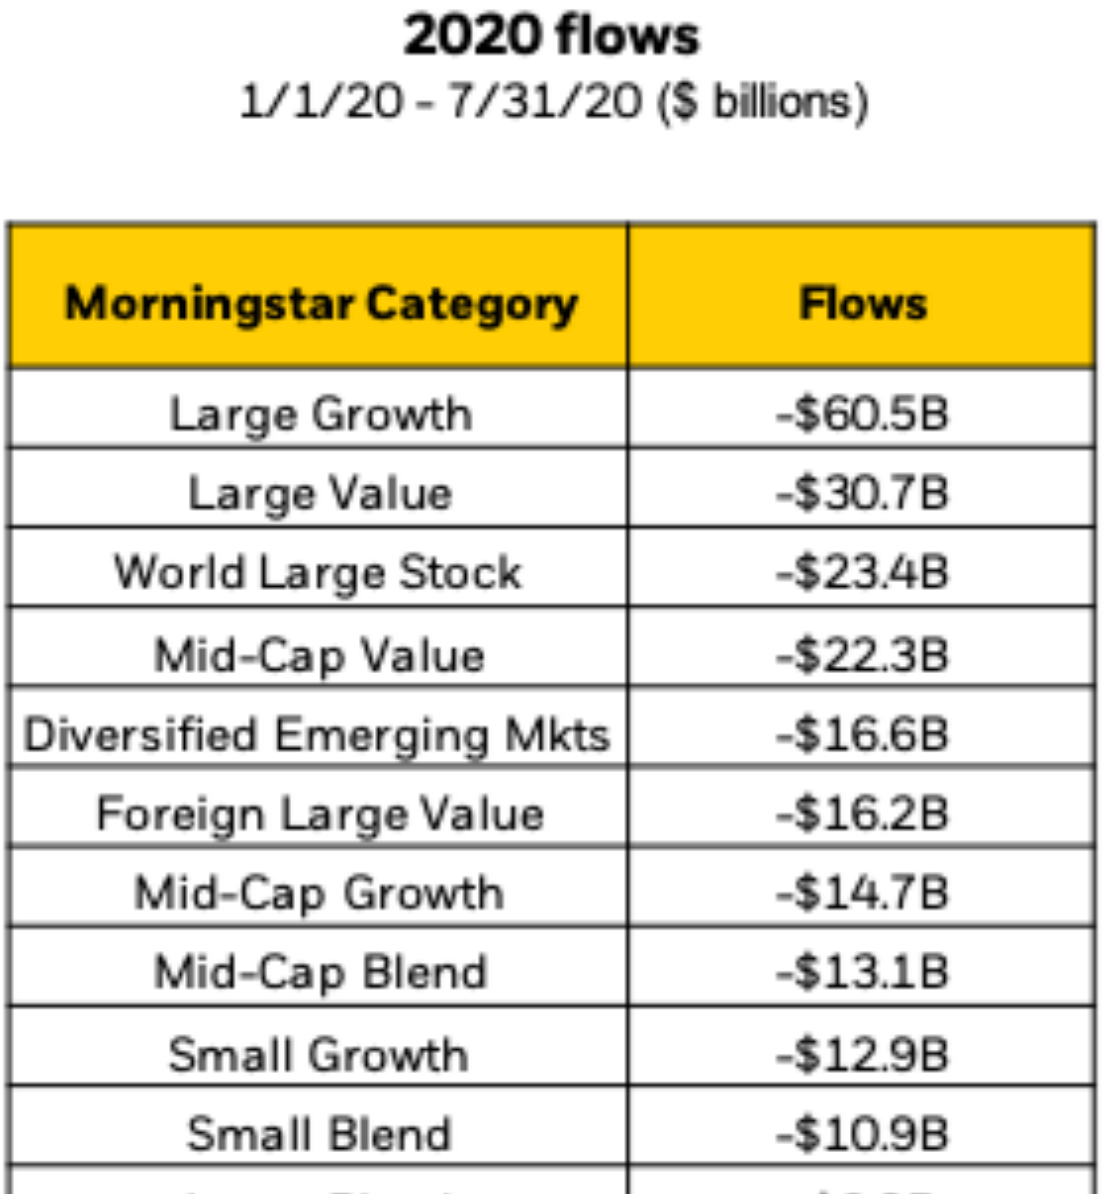
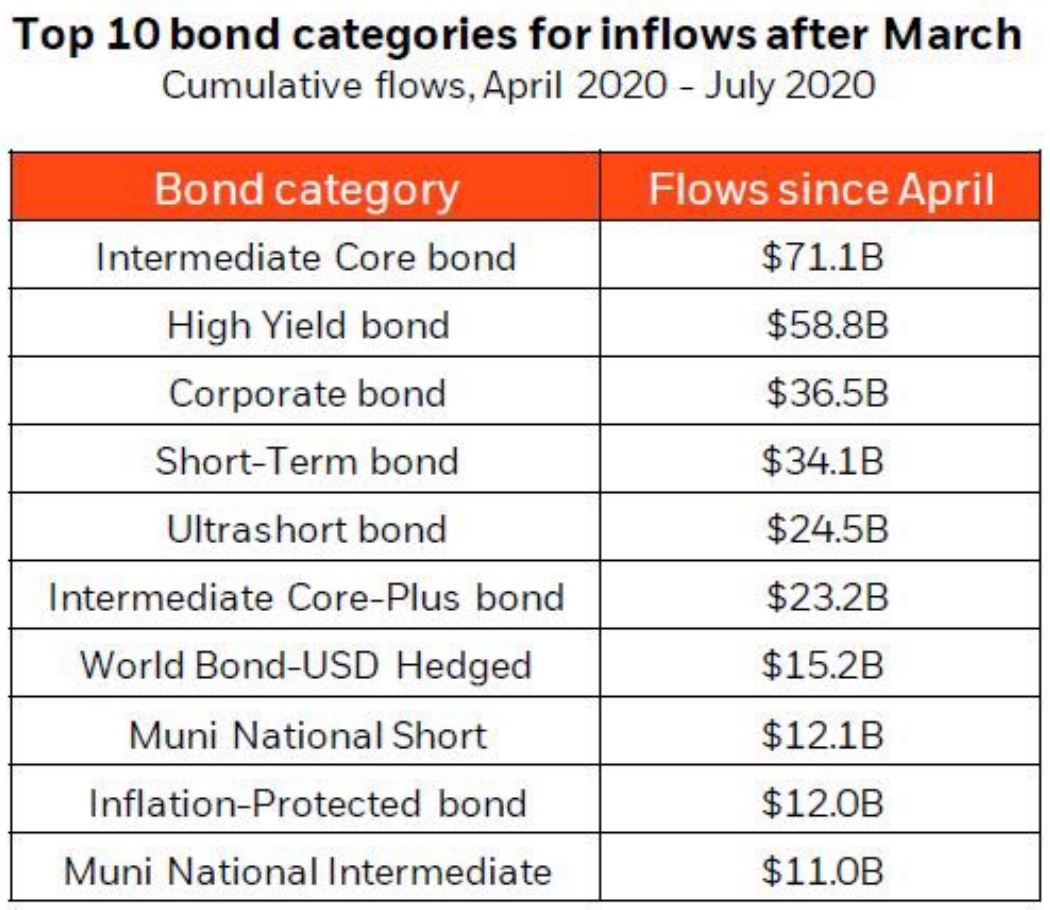
Out of Stocks and Into Betting On Zero Bonds. See 2 grids below, 2020 outflows from stock categories then bond inflows post coronavirus. It does not look like FOMO in the stock market.
Here’s Ari’s take (bold is me):
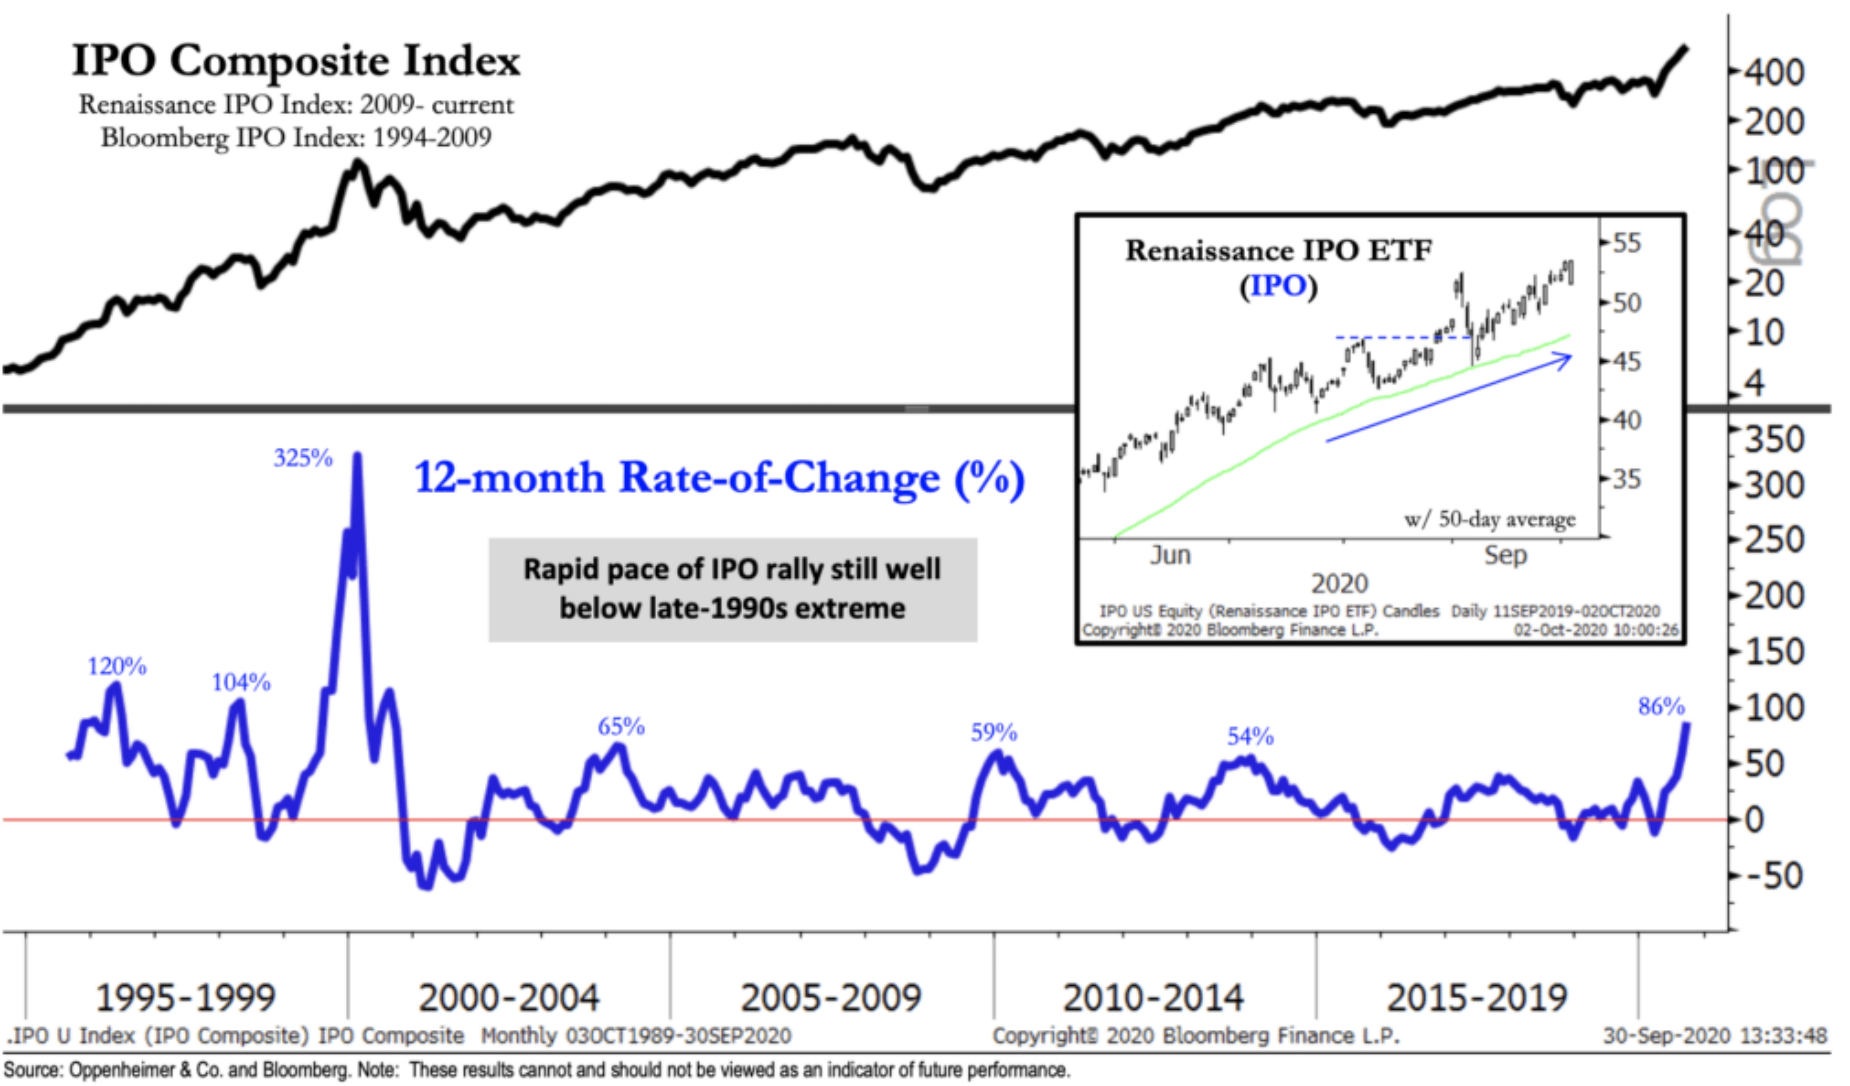
Investor concerns have also shifted to an overheated IPO market. Indeed, the Renaissance IPO ETF (IPO) has rallied since July, and the ETF’s 12-month rate-of-change now stands at 86%, the highest count in 20 years.
However, we still think it’s premature to compare this strength to that of the late 1990s, when the IPO market gained 325% in the final year into its March 2000 peak.
Overall, early signs of IPO froth are worth monitoring, but we don’t think it outweighs market positives elsewhere. Source: Inflection Points, Oppenheimer & Co – October 3rd, 2020
JOSH BROWN BLOG
https://thereformedbroker.com/2020/10/05/this-is-what-ipo-nirvana-actually-looks-like/
On December 7th, 1999, Barron’s published the infamous “What’s Wrong,Warren” cover eerily before the Nasdaq crashed 50% and Berkshire recovered years’ worth of underperformance.
The below graph plots the time period 6/30/98 through 2/29/00 for the Nasdaq where many dot-com and technology stocks traded, and the price of Berkshire Hathaway, Warren Buffett’s holding company, which consisted of value stocks:
Conclusion
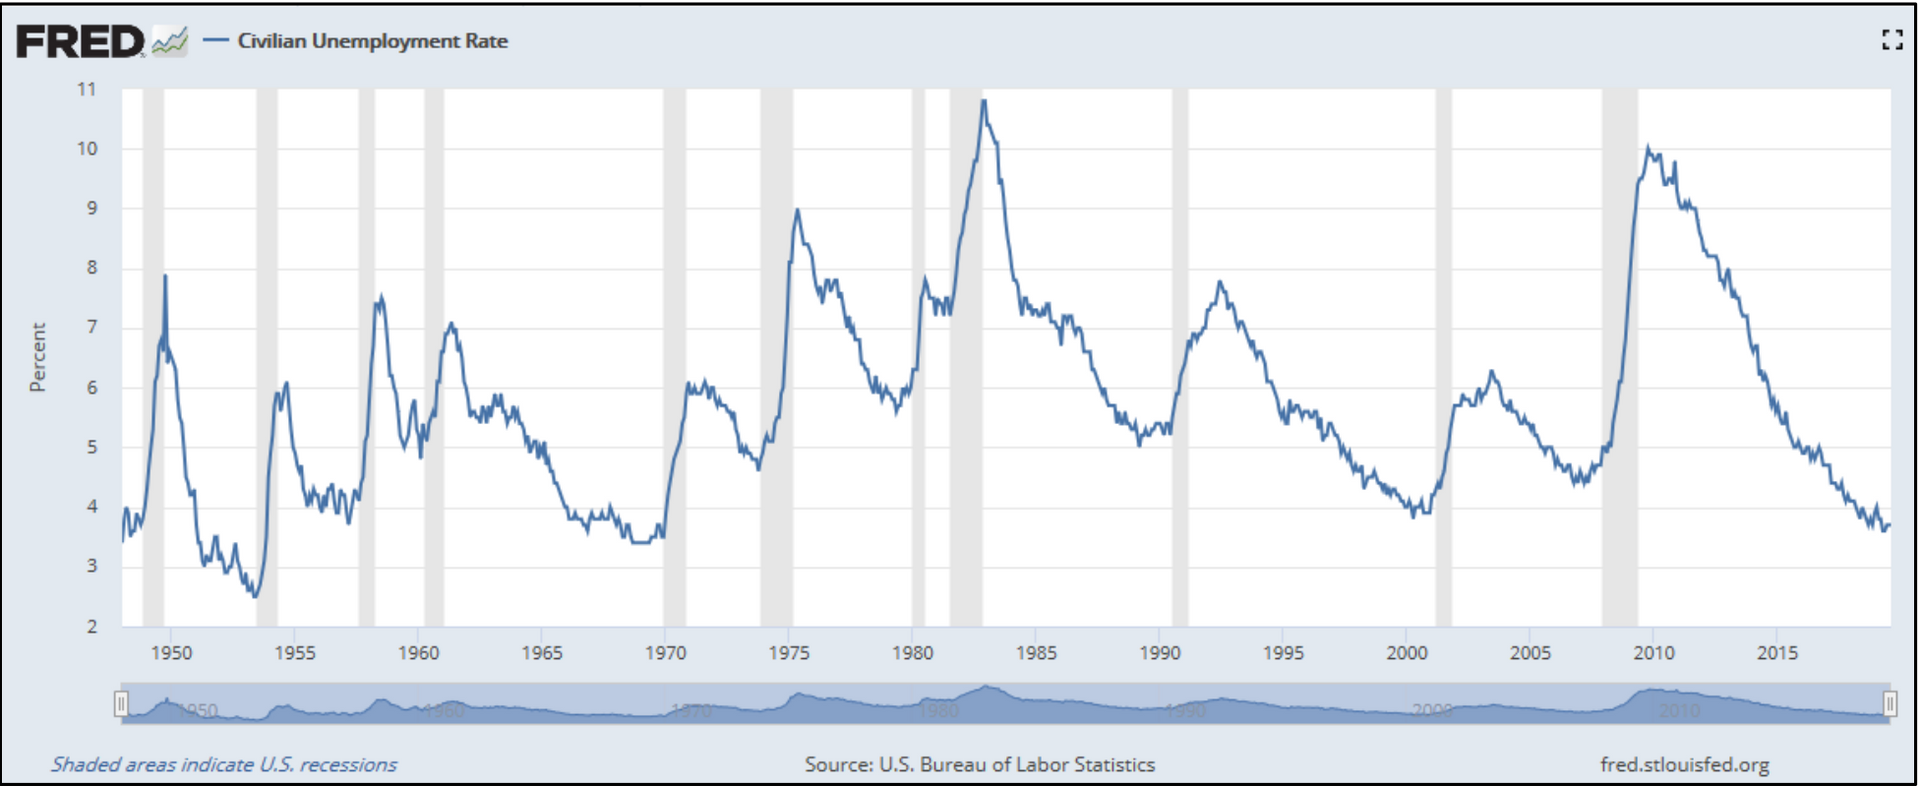
The FED has told the American public that interest rates are staying at zero for at least the next 3 years, but nothing in the markets is ever that easy. In my 25 years experience, nothing that looks like a 3 year definite bet ever plays out as planned. Rates will either go lower than anyone expects breaking zero or we will get an unexpected increase in rates as sideline cash is deployed.
Where will all this cash go - the ultimate question for 2021 and beyond. It is starting to move into the housing market, but don’t expect a housing bubble anytime soon considering we have record low inventory, record high affordability, and hugely positive demographics. In my opinion, the housing market will be healthy for the foreseeable future.
The cash could flow into the stock market and ignite a bubble or could continue to grow on the sidelines in bonds and cash, driving interest rates to below zero levels. Rather than trying to do the impossible and predict markets, we should stick to your financial plan and expect lower but acceptable returns going forward. The following grid from Vanguard illustrates expected returns for the next 10 years based on the math around valuations.
Investors should brace for lower valuations but avoid acting irrationally around elections or media headlines.
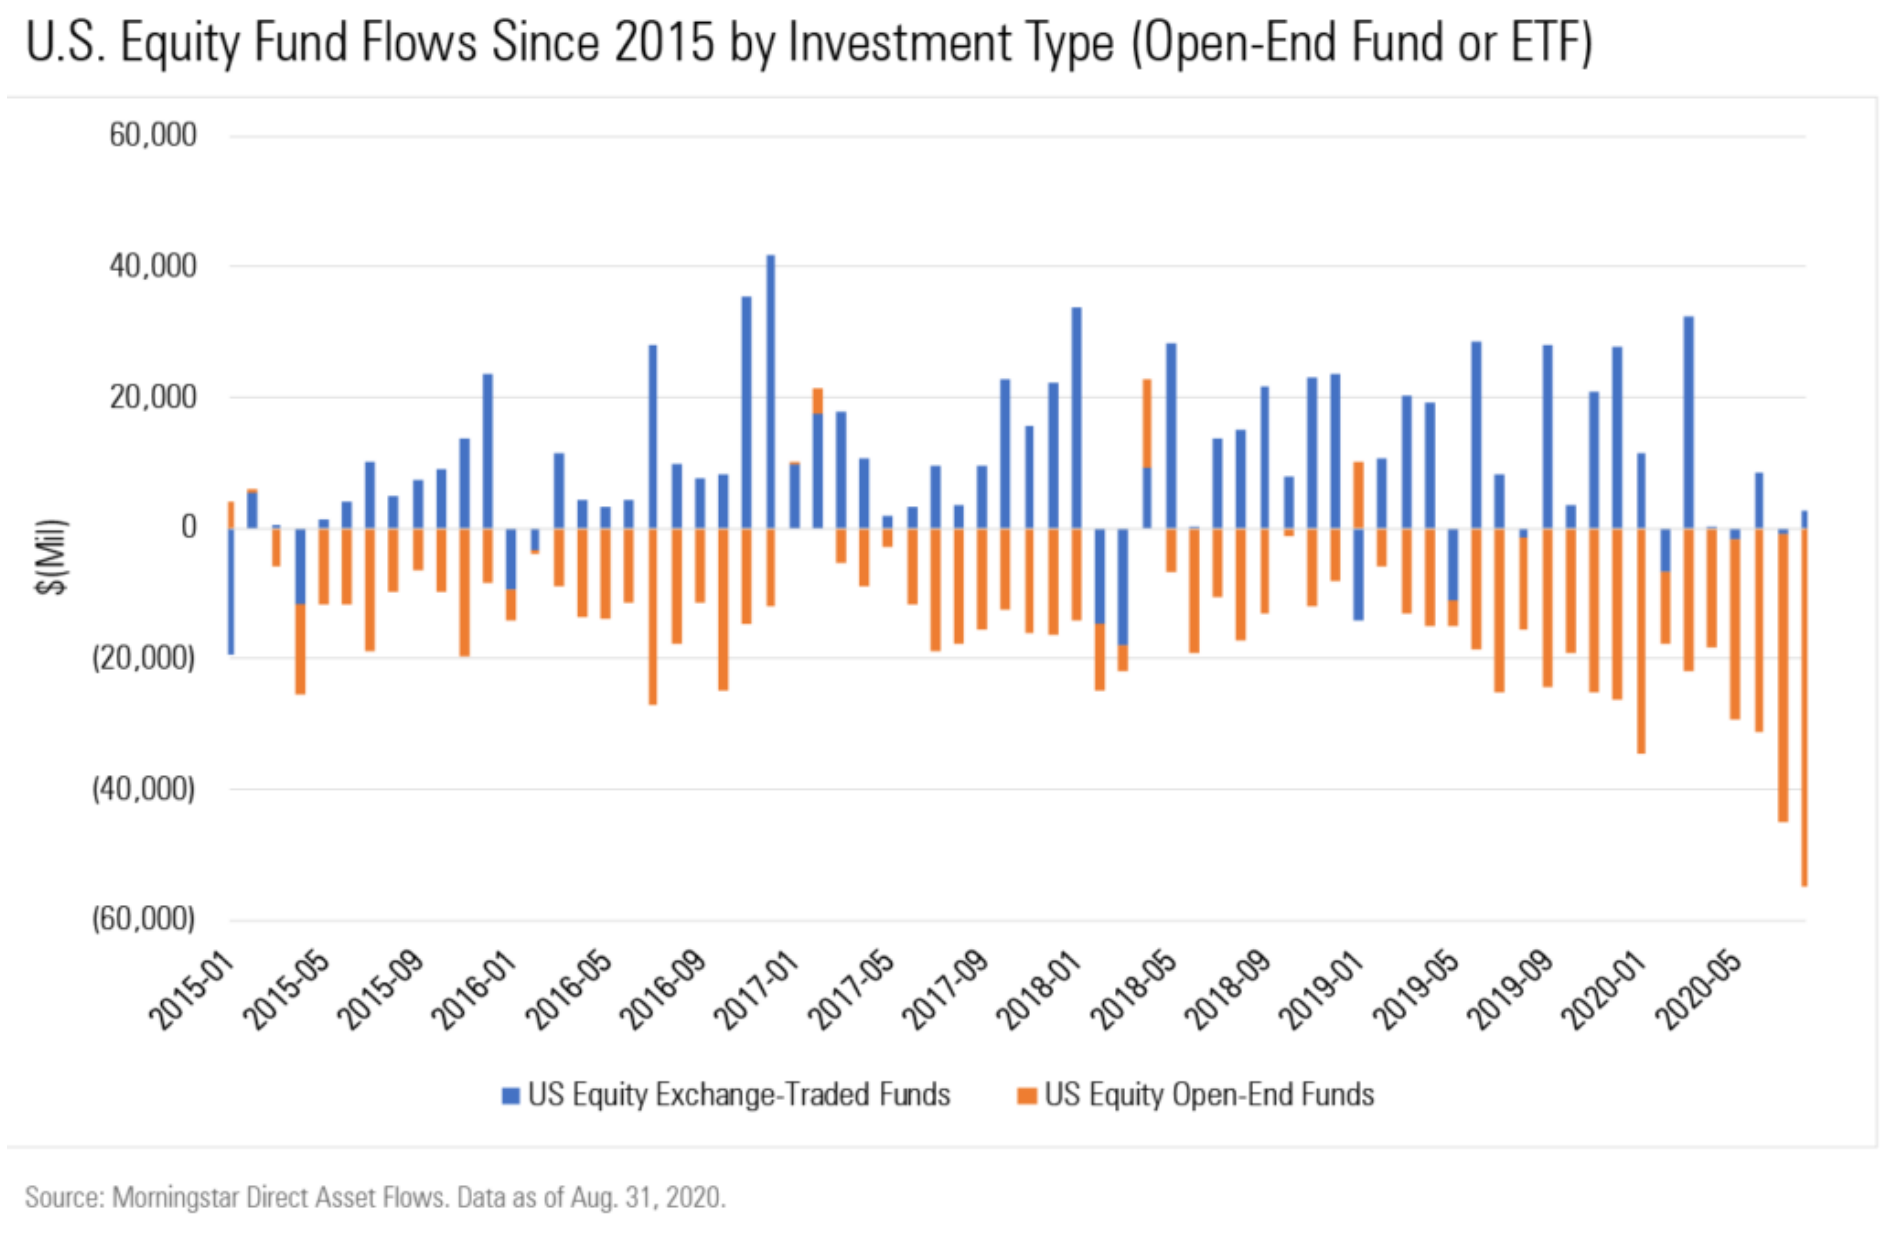
As the S&P 500 reached highs last seen in February, U.S. equity funds saw record monthly outflows in August that surpassed the previous record of $45 billion set just one month prior. As in July, all Morningstar Style Box categories (large growth, small value, and so on) suffered outflows. The main distinction was between open-end funds and ETFs. Nearly $55 billion left open-end U.S. equity funds in August; in contrast, ETFs collected $3 billion.
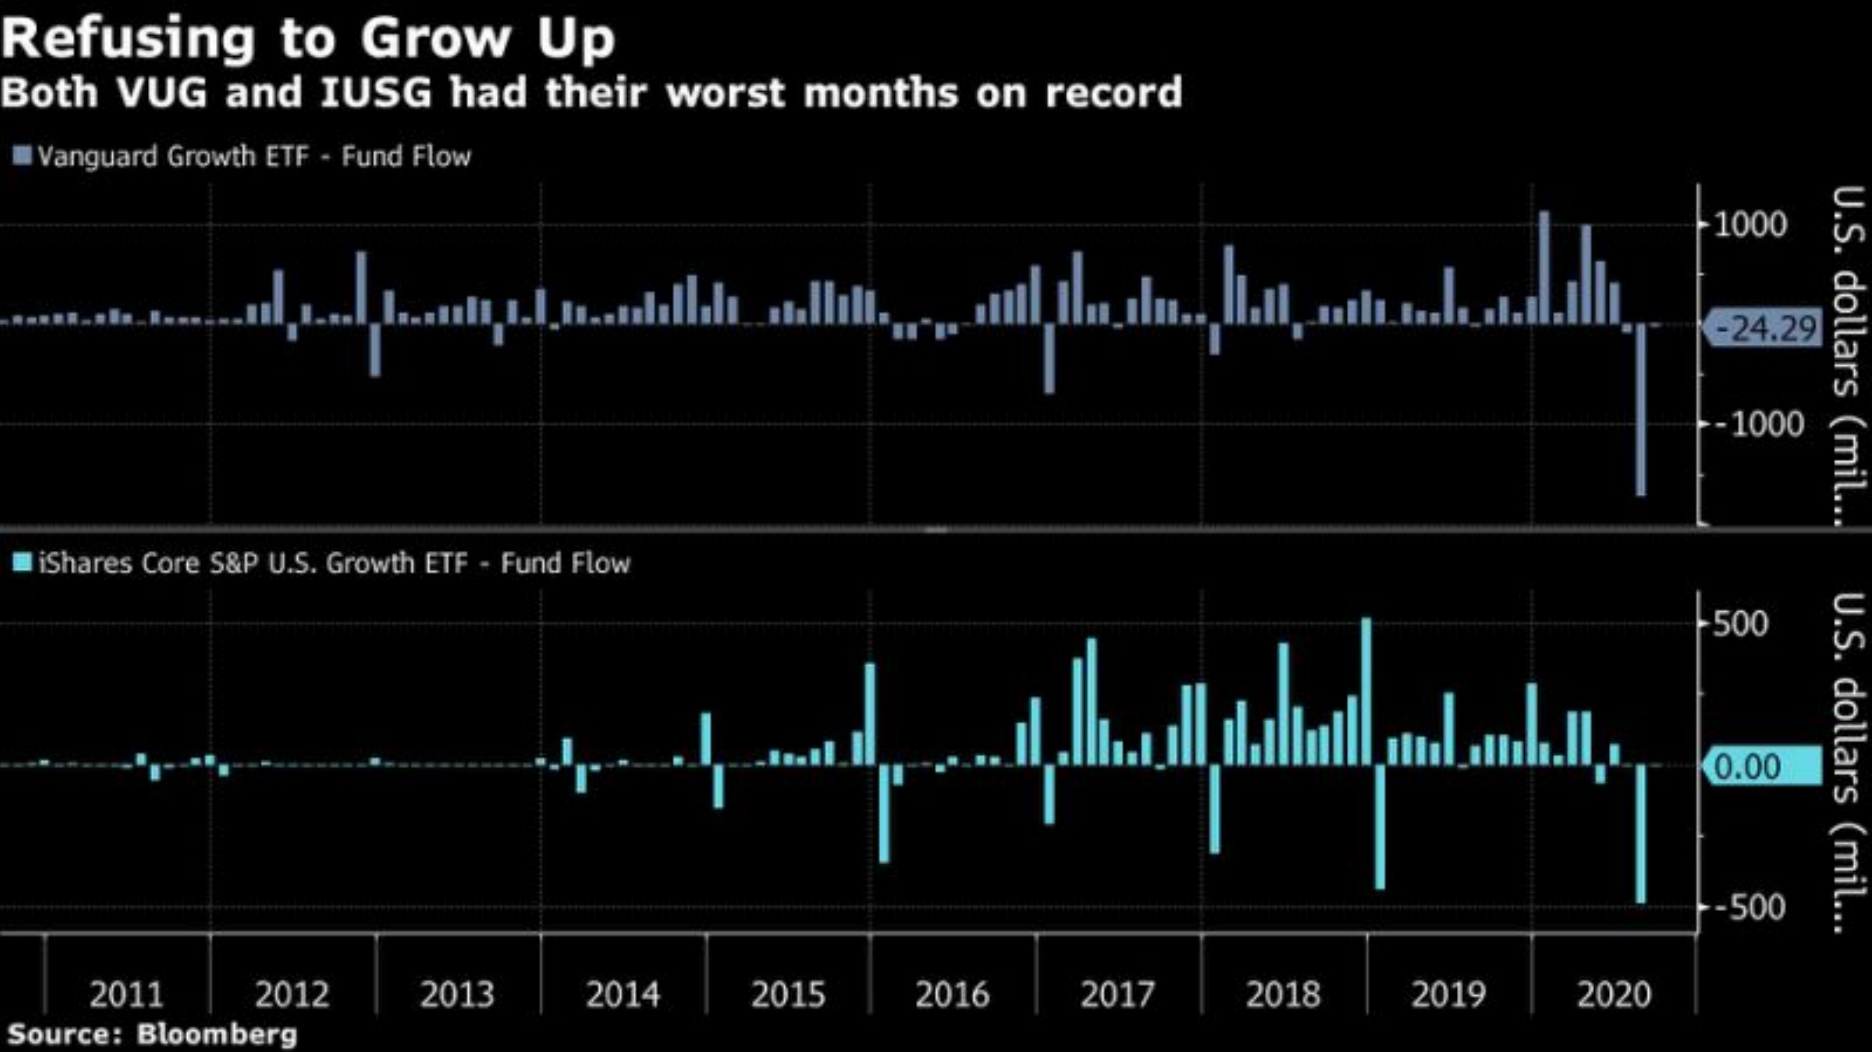
Large cap growth stocks have dominated this bull market for 10 years with a handful of tech stocks responsible for a huge portion of the S&P total return. This trend was exacerbated during the COVID crisis as work from home favored tech giants. Therefore, logic would suggest that investors are loading up on the growth ETFs that hold these names; but on the contrary, popular growth ETFs saw record monthly outflows in the August/September period.
From Barry Ritholtz The Big Picture Blog
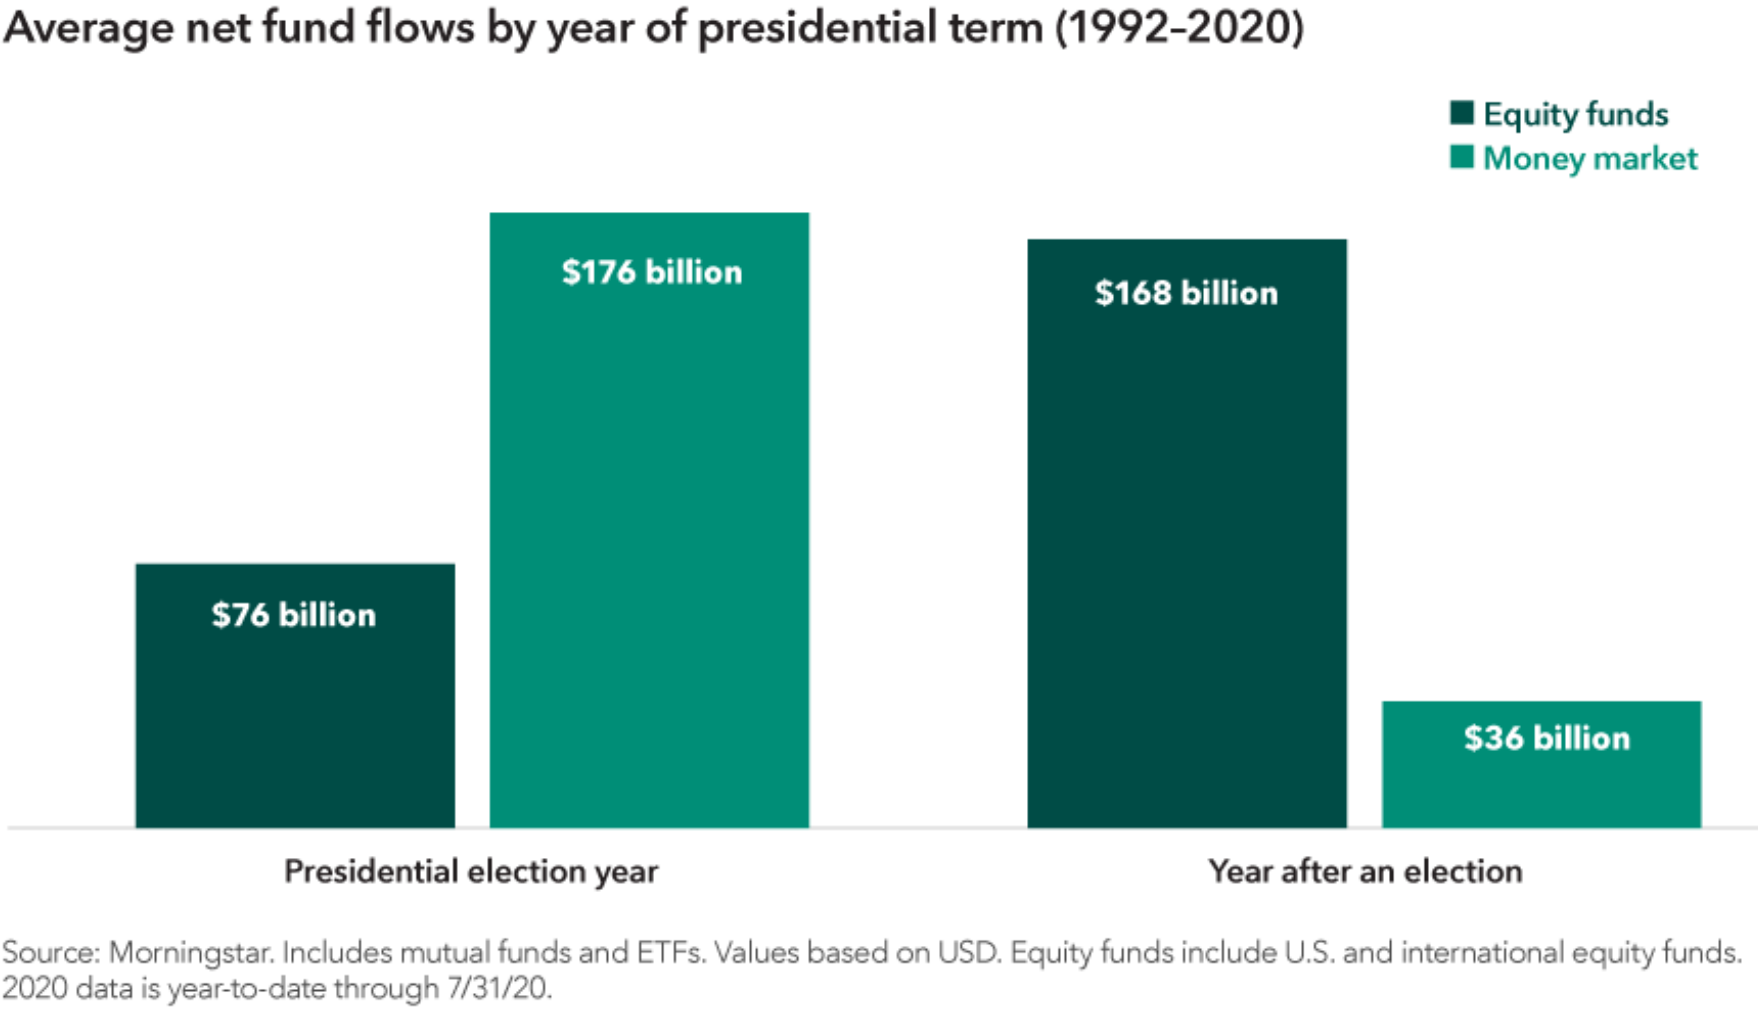
Although this election is unprecedented due to virus lockdowns, among other reasons, the below history may give us an edge as to where the next set of flows may land. At the same time, it is my opinion that no matter who wins the election, an infrastructure bill will be in the near-term future.
Investors Become Conservative in Election Years.
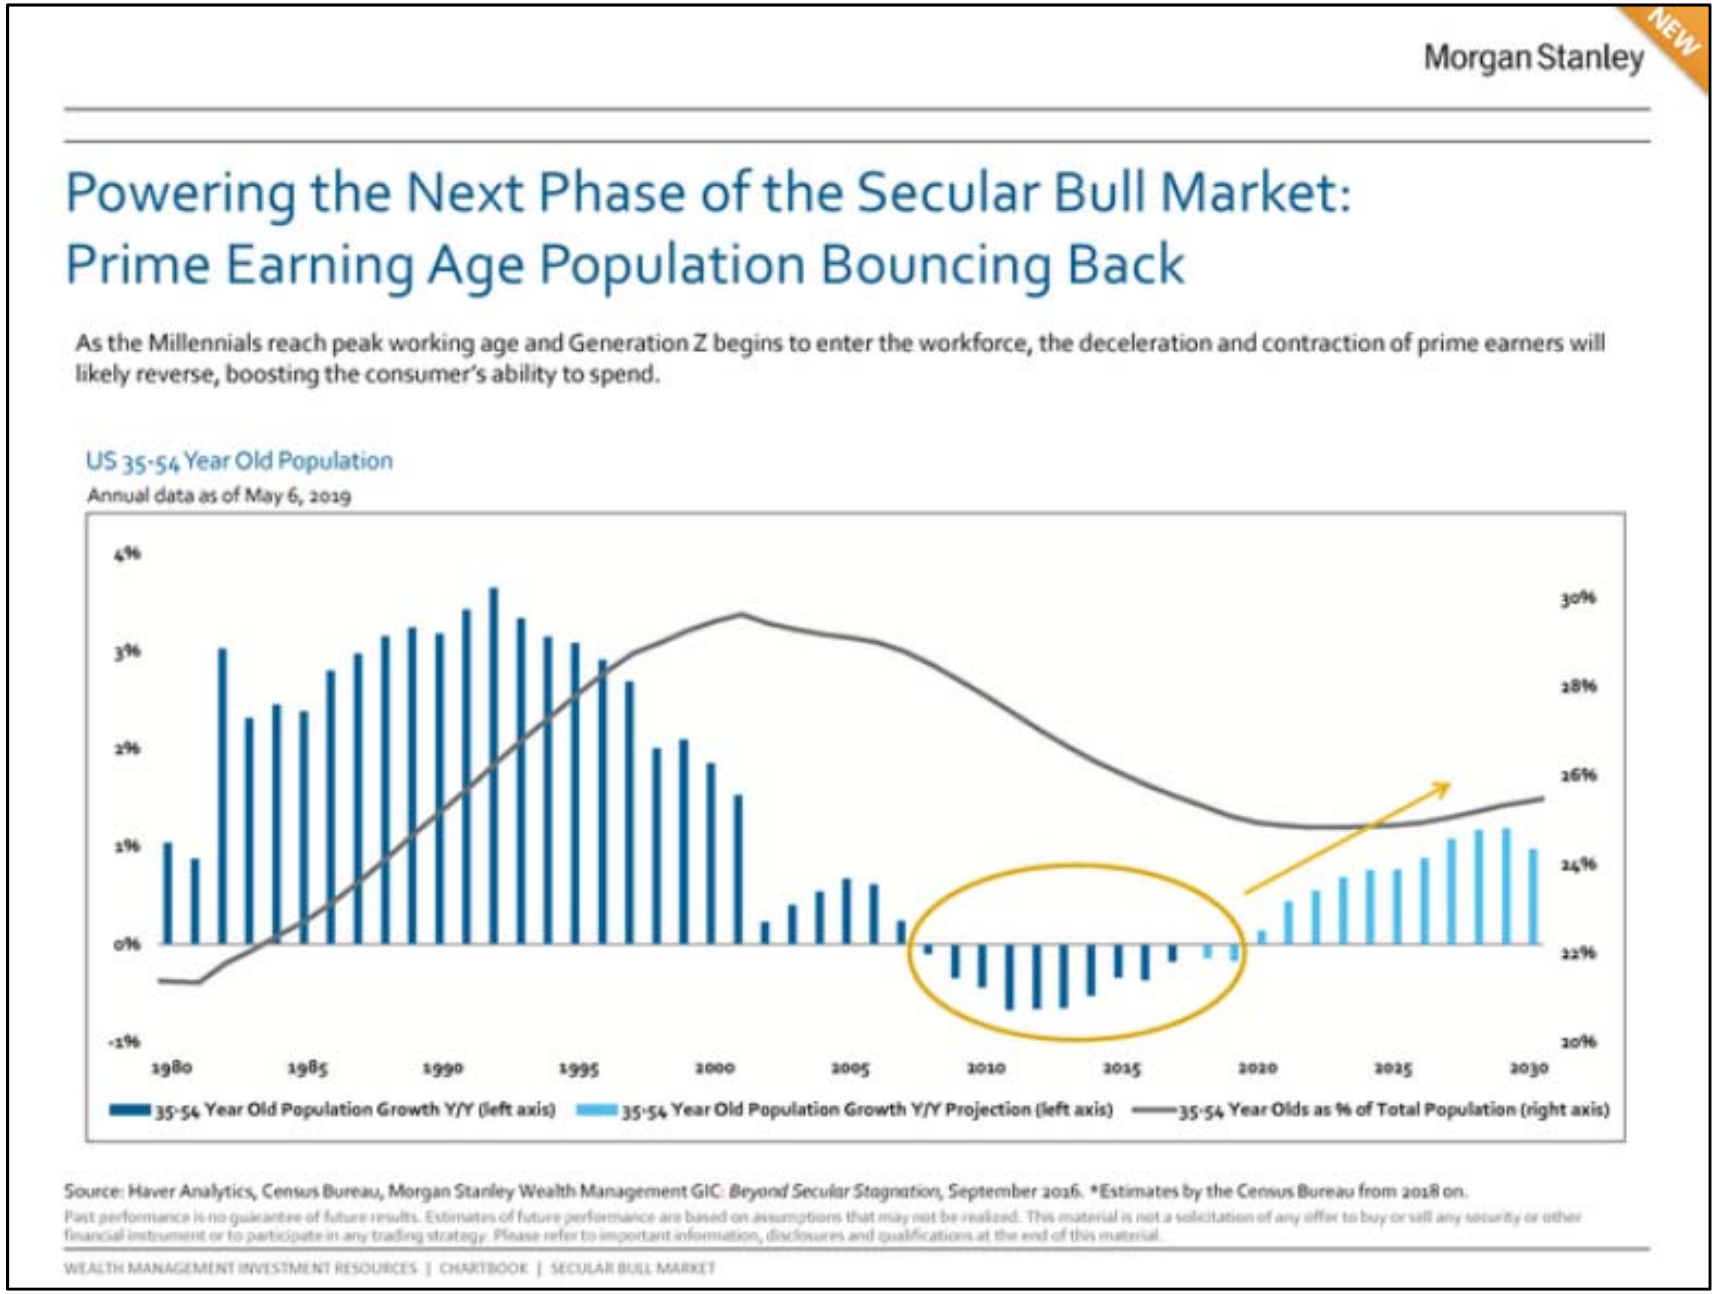
The Fed’s Major Policy Shift By Matthew C. Klein
THIRD QUARTER LETTER - OCTOBER 2020
Where the Money is Flowing?
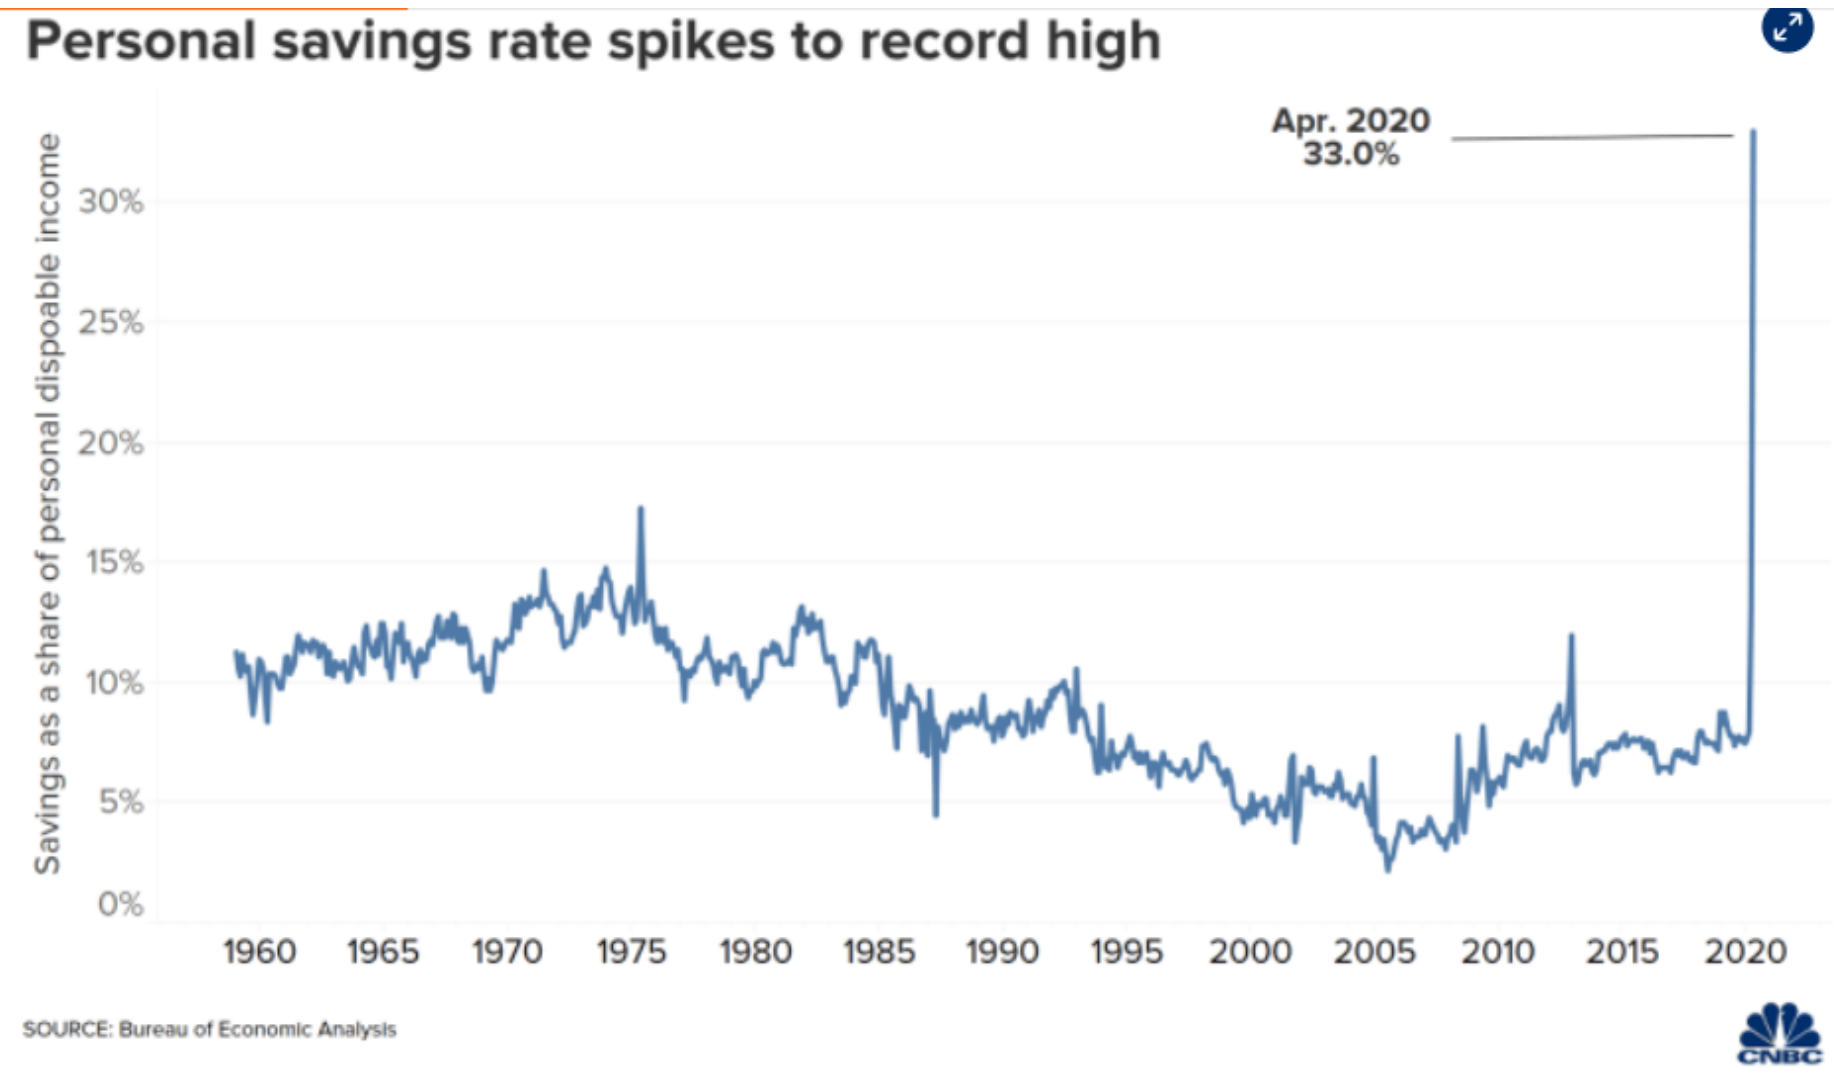
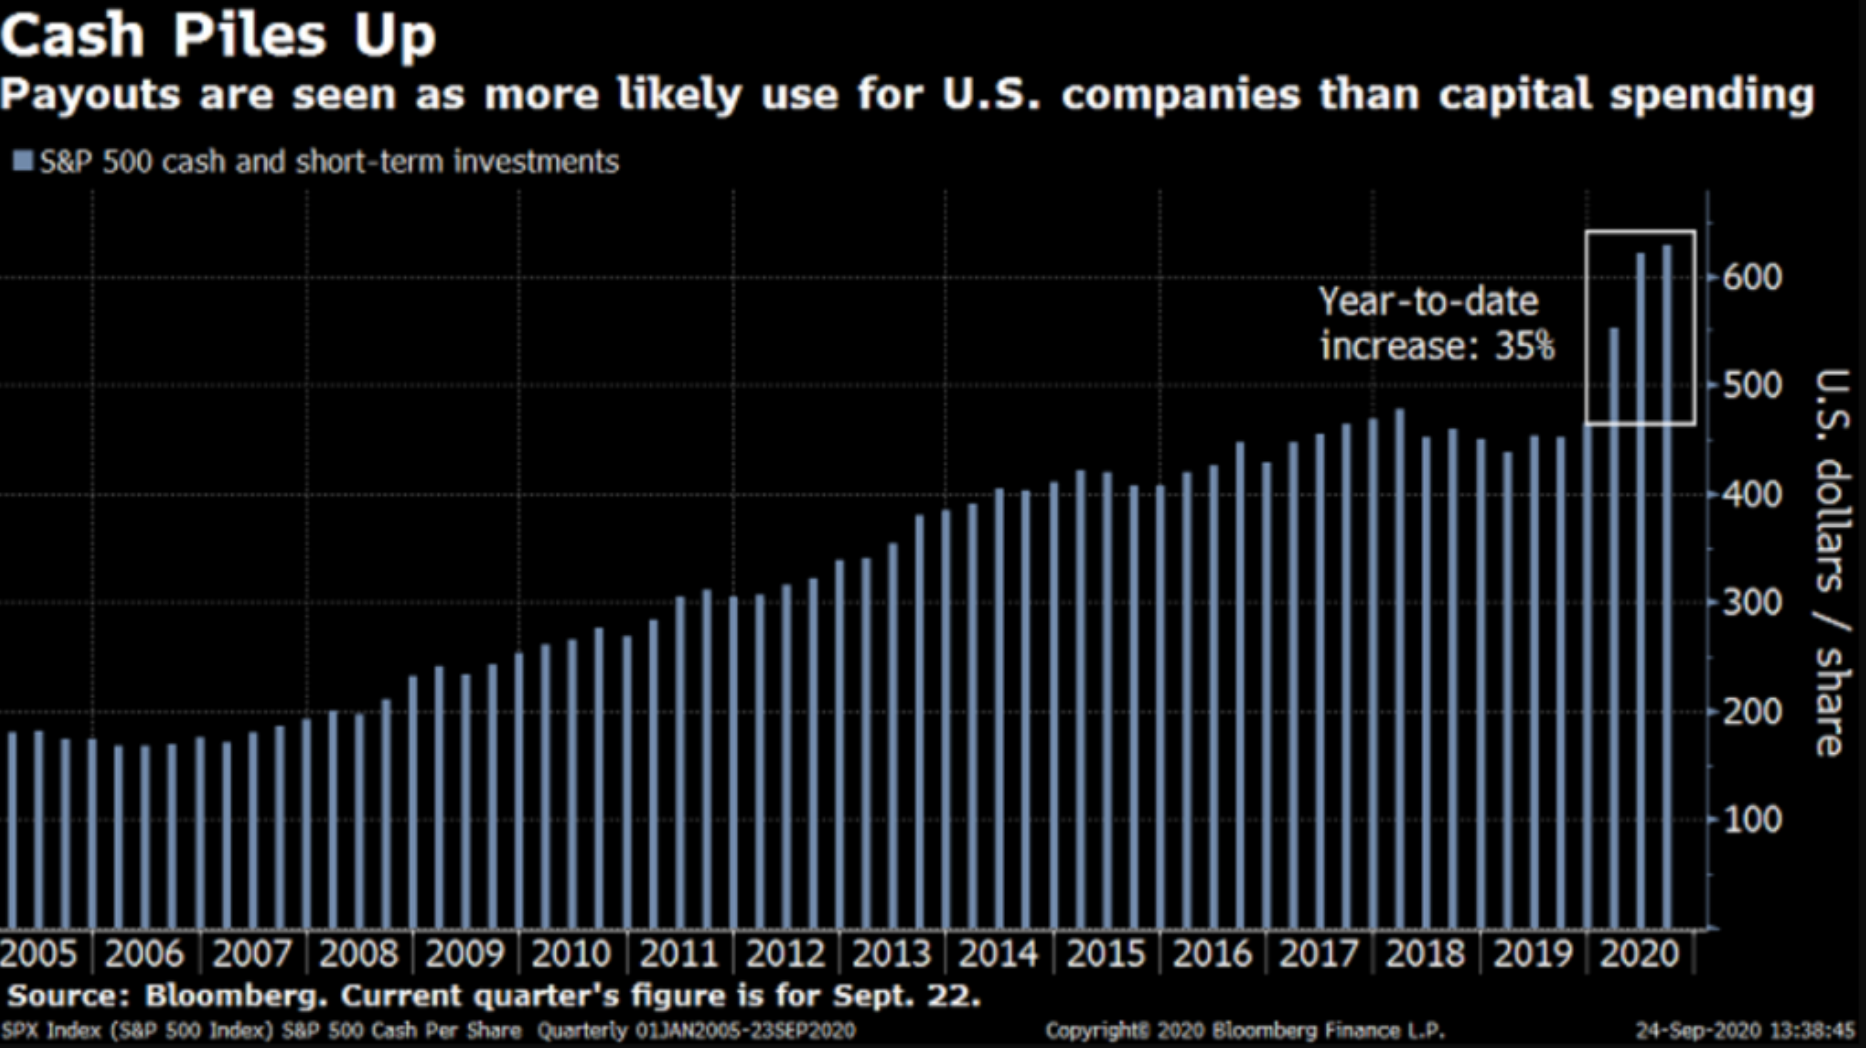
Contrary to the FOMO thesis, American investors and corporations are socking away their cash like never before despite earning a negative inflation-adjusted return. The current stock market recovery occurred with more money flowing into bonds than stocks and the personal savings rate skyrocketing to 30%. At the same time, S&P 500 companies took advantage of low rates to load up their balance sheets with record amounts of cash. Every stock market category has experienced net outflows in 2020.
U.S. Stock Funds Saw Record Outflows in August with Large Cap Blend Leading The Biggest Withdrawals.
U.S. Fund Flows Batter Equity Funds in August As stocks rise, investors shift from U.S. equity to taxable-bond funds. https://www.morningstar.com/articles/1001536/us-fund-flows-batter-equity-funds-in-august
Found at The Irrelevant Investor Blog
https://theirrelevantinvestor.com/2020/09/17/where-are-they-going/
American Citizens and Corporations are Betting On Zero
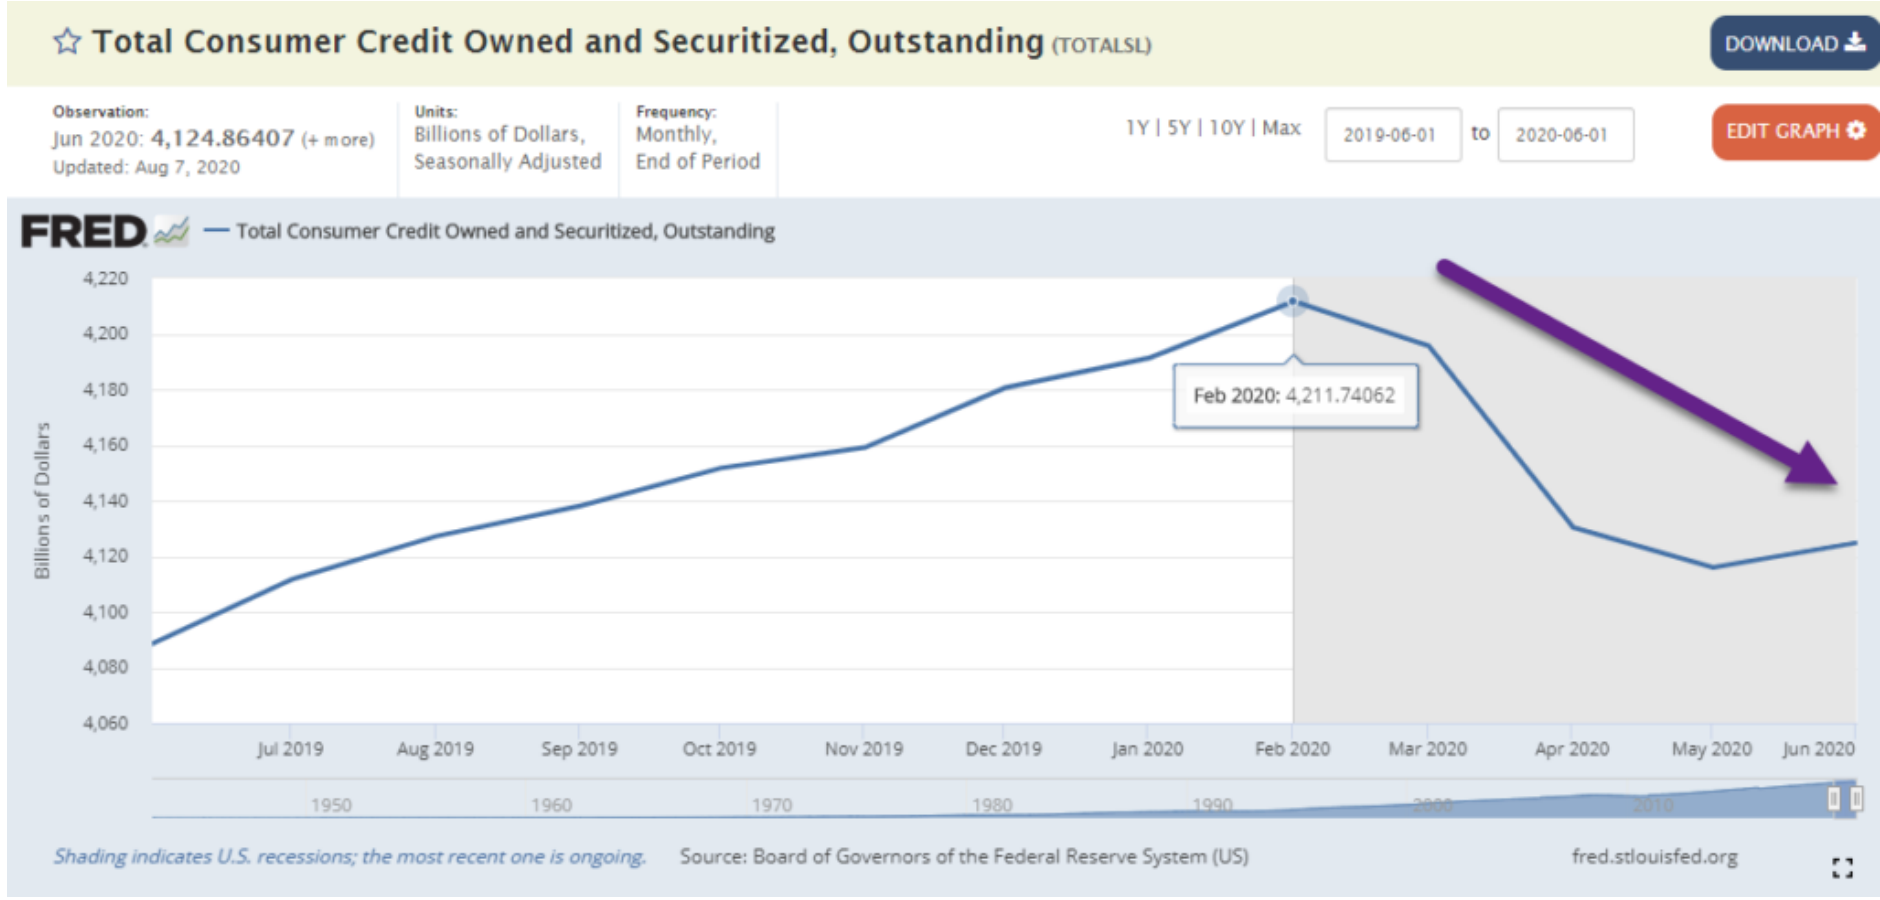
The above action is not the behavior of investors during a stock market bubble. During periods of unsustainable valuations we see investors in a frantic rage to buy more stock. Instead, COVID 2020 is seeing a bubble in, of all things, pure green cash. American investors are paying down debt and building up cash at rates not witnessed in our lifetimes, the polar opposite of the great financial crisis of 2008 when the public was levered up beyond sustainable levels. The personal savings rate is at record highs while simultaneously households have slashed credit card balances by $106 billion.
In 4 Months Households Slashed Credit Card Balances by a Record $106 Billion.
Barrons—“That newfound thrift is evidenced further by households slashing their credit-card balances by a record $106 billion in the latest four months, more than double the rate of deleveraging during what is still called the Great Recession—even though the current downturn will dwarf all others since the Great Depression.”
What, Us Worry? Lack of New Stimulus Hasn’t Roiled the Markets
By Randall W. Forsyth
2020 Credit Card Balances Chart—FRED charts
S&P 500 Cash +35% Year to Date
On top of middle-class Americans building up cash, S&P 500 stocks increased cash by 35% post virus. Will this money flow to buybacks, dividends, or capital spending? A capital spending splurge plus a government infrastructure build would be a GDP boosting combination.
https://www.capitalgroup.com/advisor/insights/articles/how-elections-move-markets-5-charts.html
The U.S. experienced the ultimate black swan event and the FED answered with unprecedented fire power. They acted much faster than in 2008, but the bubble created this time could be in government debt or is yet to come in the stock market. Many investors are comparing 2020 to 1999 with huge technology stock outperformance and a red hot IPO market, but we are still nowhere near the turn of century bubble I witnessed firsthand to start my career.
IPO Market 12 Month Rate of Change 2020 +86% vs. 1999 +325
The other popular bubble commentary is around the IPO market. New companies are starting to have big spikes on initial trading days but we are nowhere near 1999 bubble levels in new issue market. Josh Brown at Reformed Broker lays out the 12-month rate of change in IPO’s today versus 1999 and we see over a 3x higher return in 1999 (see chart below). Companies are staying private longer and coming to the market in much better financial shape. We will see if this changes post-election. If we get an unleashing of the cash on the sidelines, a new bubble might be underway.
Reformed Broker Josh Brown Blog--I’m showing you a chart below that Ari Wald at Oppenheimer just put out, I think it’s a good way of viewing the difference between IPO performance in this era, versus that era. One of my guests from the podcast was Kathleen Smith, whose firm Renaissance Capital is actually the sponsor of the ETF Ari is looking at here:
Leveraged loans are up 50 percent since 2015
Leveraged loans, which are issued by overleveraged companies with insufficient cash flows, are part of what Wolf Richter recently called the “gigantic pile of risky corporate debt that is now being brutally repriced as concerns over credit risk (the risk of default) are finally bubbling to the surface.” According to Richter, the S&P/LSTA US Leveraged Loan 100 Index, which tracks the prices of the largest leveraged loans, has plunged by 20 percent since February 22nd.
According to Richter, leveraged loans “are traded in slices like securities or are packaged into highly rated Collateralized Loan Obligations (CLOs). But for years, investors had the hots for them, driven by their relentless chase for yield, in a world of interest rate repression.”
These companies, noted Richter, were often acquired by private equity firms through leveraged buyouts, which means they loaded up those companies with lots of debt. In addition, “PE firms extracted special dividends from their companies,” which were funded by leveraged loans. That’s a form of asset stripping and it leaves the company “more leveraged, more precarious and more likely to topple. But who cares? Those were the good times and the chase for yield was on,” lamented Richter.
Two Giant Growth Funds Suffer Biggest Selling Stampede on Record-VUG and IUSGClaire Ballentine-Bloomberg
Grid courtesy of Blackrock
The Case For a Post-Covid Spending Boomby Ben Carlson
https://awealthofcommonsense.com/2020/08/the-case-for-a-post-covid-spending-boom/
Thank you,
Matt Topley
President & CEO
Lansing Street Advisors
Disclosure
Lansing Street Advisors is a registered investment adviser with the State of Pennsylvania..
To the extent that content includes references to securities, those references do not constitute an offer or solicitation to buy, sell or hold such security as information is provided for educational purposes only. Articles should not be considered investment advice and the information contain within should not be relied upon in assessing whether or not to invest in any securities or asset classes mentioned. Articles have been prepared without regard to the individual financial circumstances and objectives of persons who receive it. Securities discussed may not be suitable for all investors. Please keep in mind that a company’s past financial performance, including the performance of its share price, does not guarantee future results.Material compiled by Lansing Street Advisors is based on publicly available data at the time of compilation. Lansing Street Advisors makes no warranties or representation of any kind relating to the
accuracy, completeness or timeliness of the data and shall not have liability for any damages of any kind relating to the use such data.Material for market review represents an assessment of the market environment at a specific point in time and is not intended to be a forecast of future events, or a guarantee of future results.Indices that may be included herein are unmanaged indices and one cannot
directly invest in an index. Index returns do not reflect the impact of any management fees, transaction costs or expenses. The index information included herein is for illustrative purposes only.

HAS AMERICA BEEN SAVED BY ZERO?
Is the FED Igniting Another 1999?
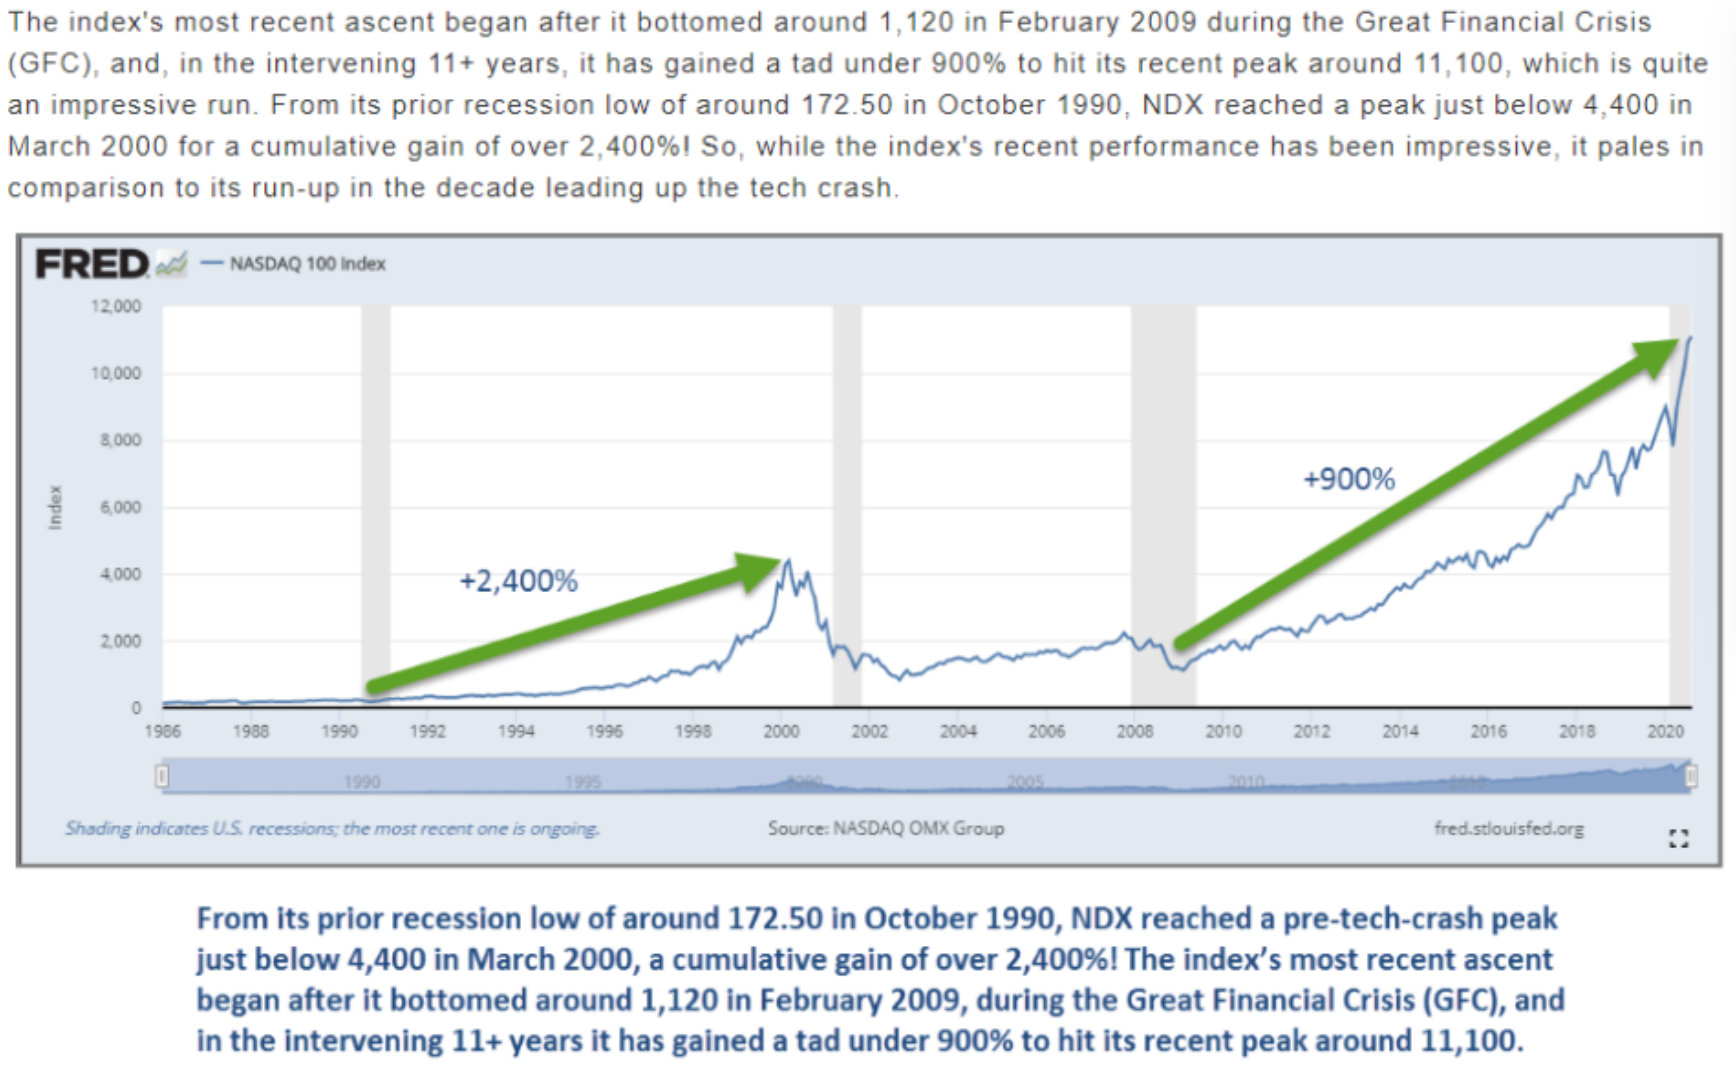
The below graphic illustrated that the Nasdaq 100, although expensive, is nowhere near 1999 bubble levels. In 1999 the NDX had a price to earning ratio of 73 versus in the 30’s today. The returns from 1990 recession lows to 1999 bubble highs was +2400% versus 900% today. Although there are similarities, such as the valuation spreads between growth and value, as well as the percentage market cap share of tech in the S&P, pure returns and valuations are still far below 1999 internet bubble peaks.
From a fundamental valuation perspective, the NDX of today also looks quite different than the NDX of 2000. The index currently has a price-to-earnings (PE) ratio of 32.74, which is the highest level it has reached since the GFC and significantly higher than the S&P 500’s SPX PE of 22.99 (Source: FactSet). At the end of 1999 however, NDX had a PE ratio slightly north of 73, or more than twice its current level! It is also worth noting that the S&P’s PE ratio at that time was above 30, a level it has not breached since 2000.