
Introduction
Investors need to be careful about all the historical comparisons to 2022 because the markets are experiencing several unique events such as the global pandemic, the first global yield curve inversion ever, the Fed raising interest rates in a slowing economy, S&P stock concentration peak, a conventional war on European land, and the fastest pace of rate raises in modern times.
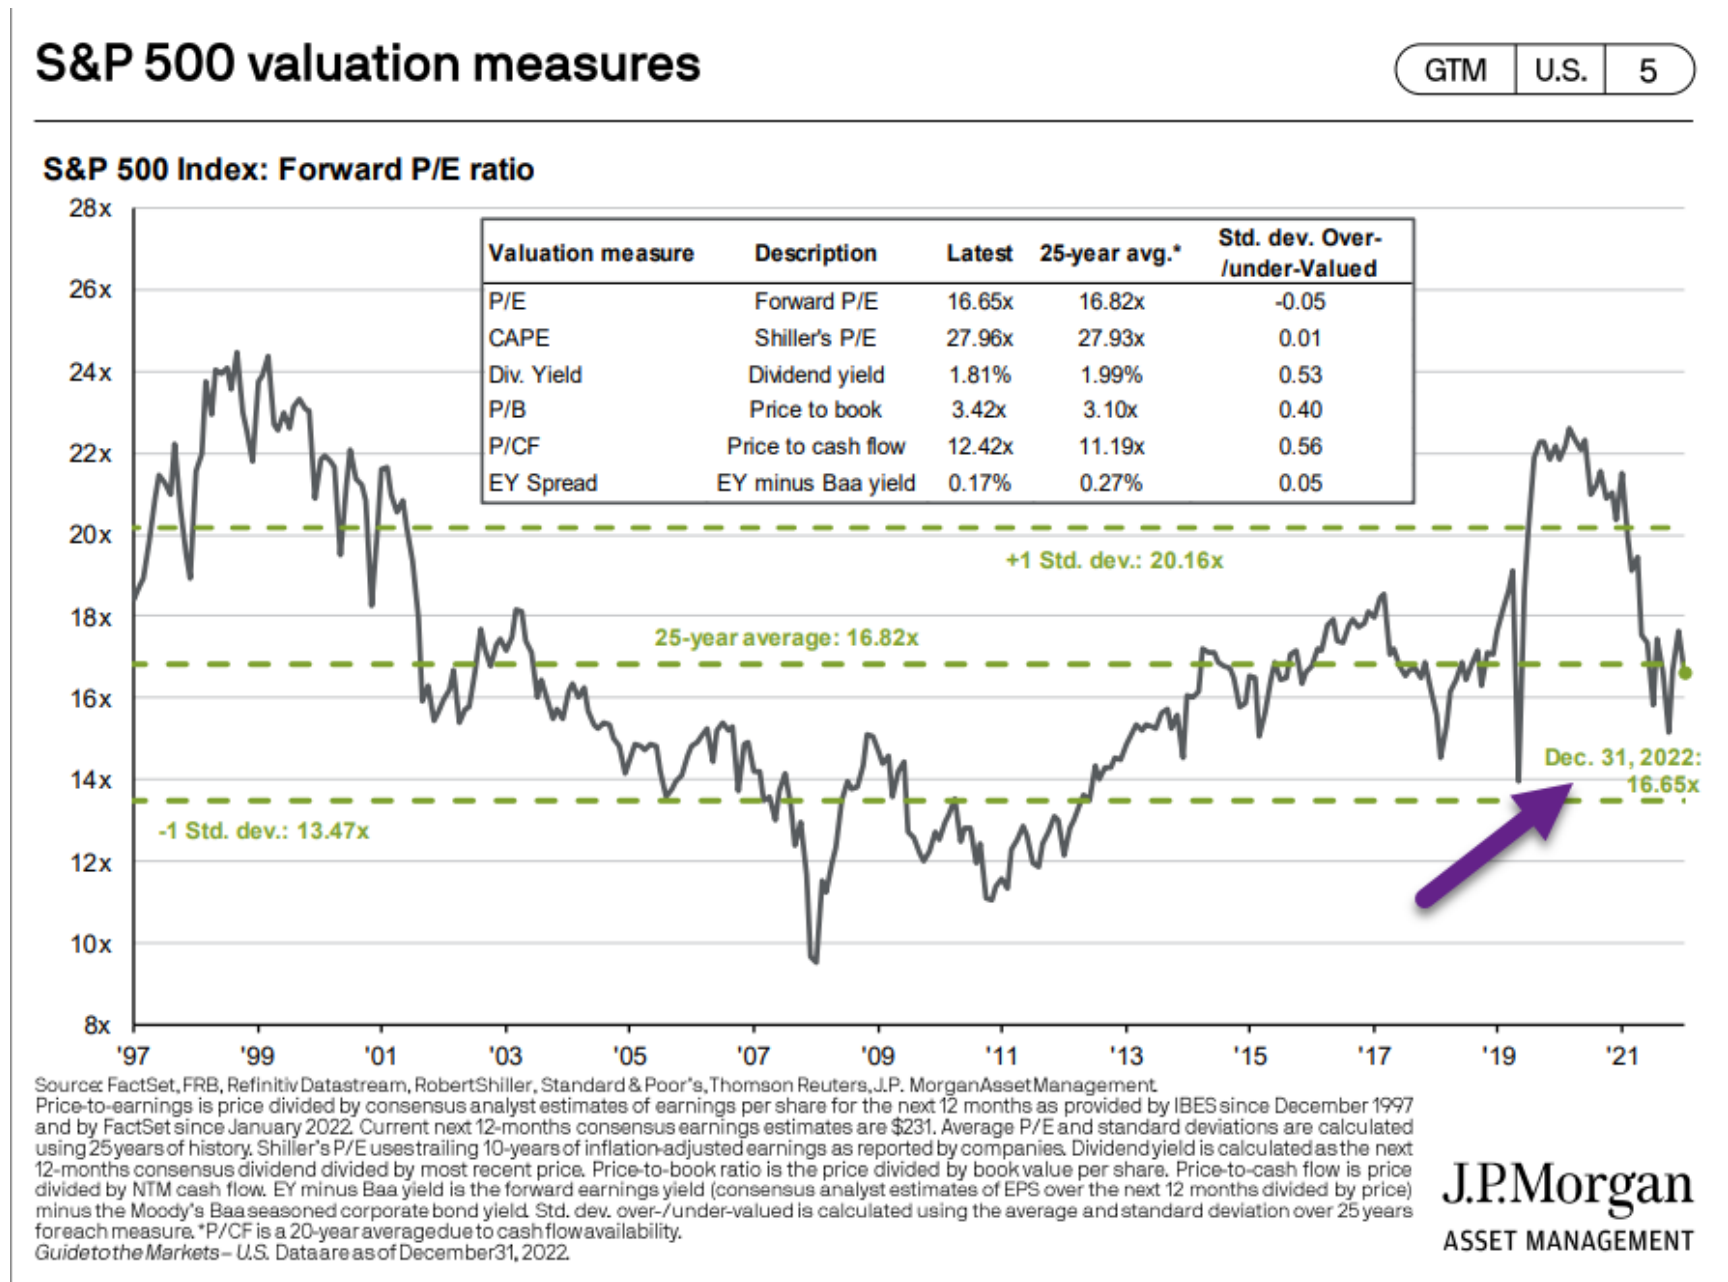
Those expeditious rate raises by the Fed accomplished the dual mission of popping bubbles and reducing inflation. This has left the stock market “Stuck in the Middle with You.” The following chart from JP Morgan shows the S&P forward P/E ratio sitting right in the center of the 25-year average. If you remove FAANG stocks the P/E ratio falls closer to the bottom of the band 14x earnings.
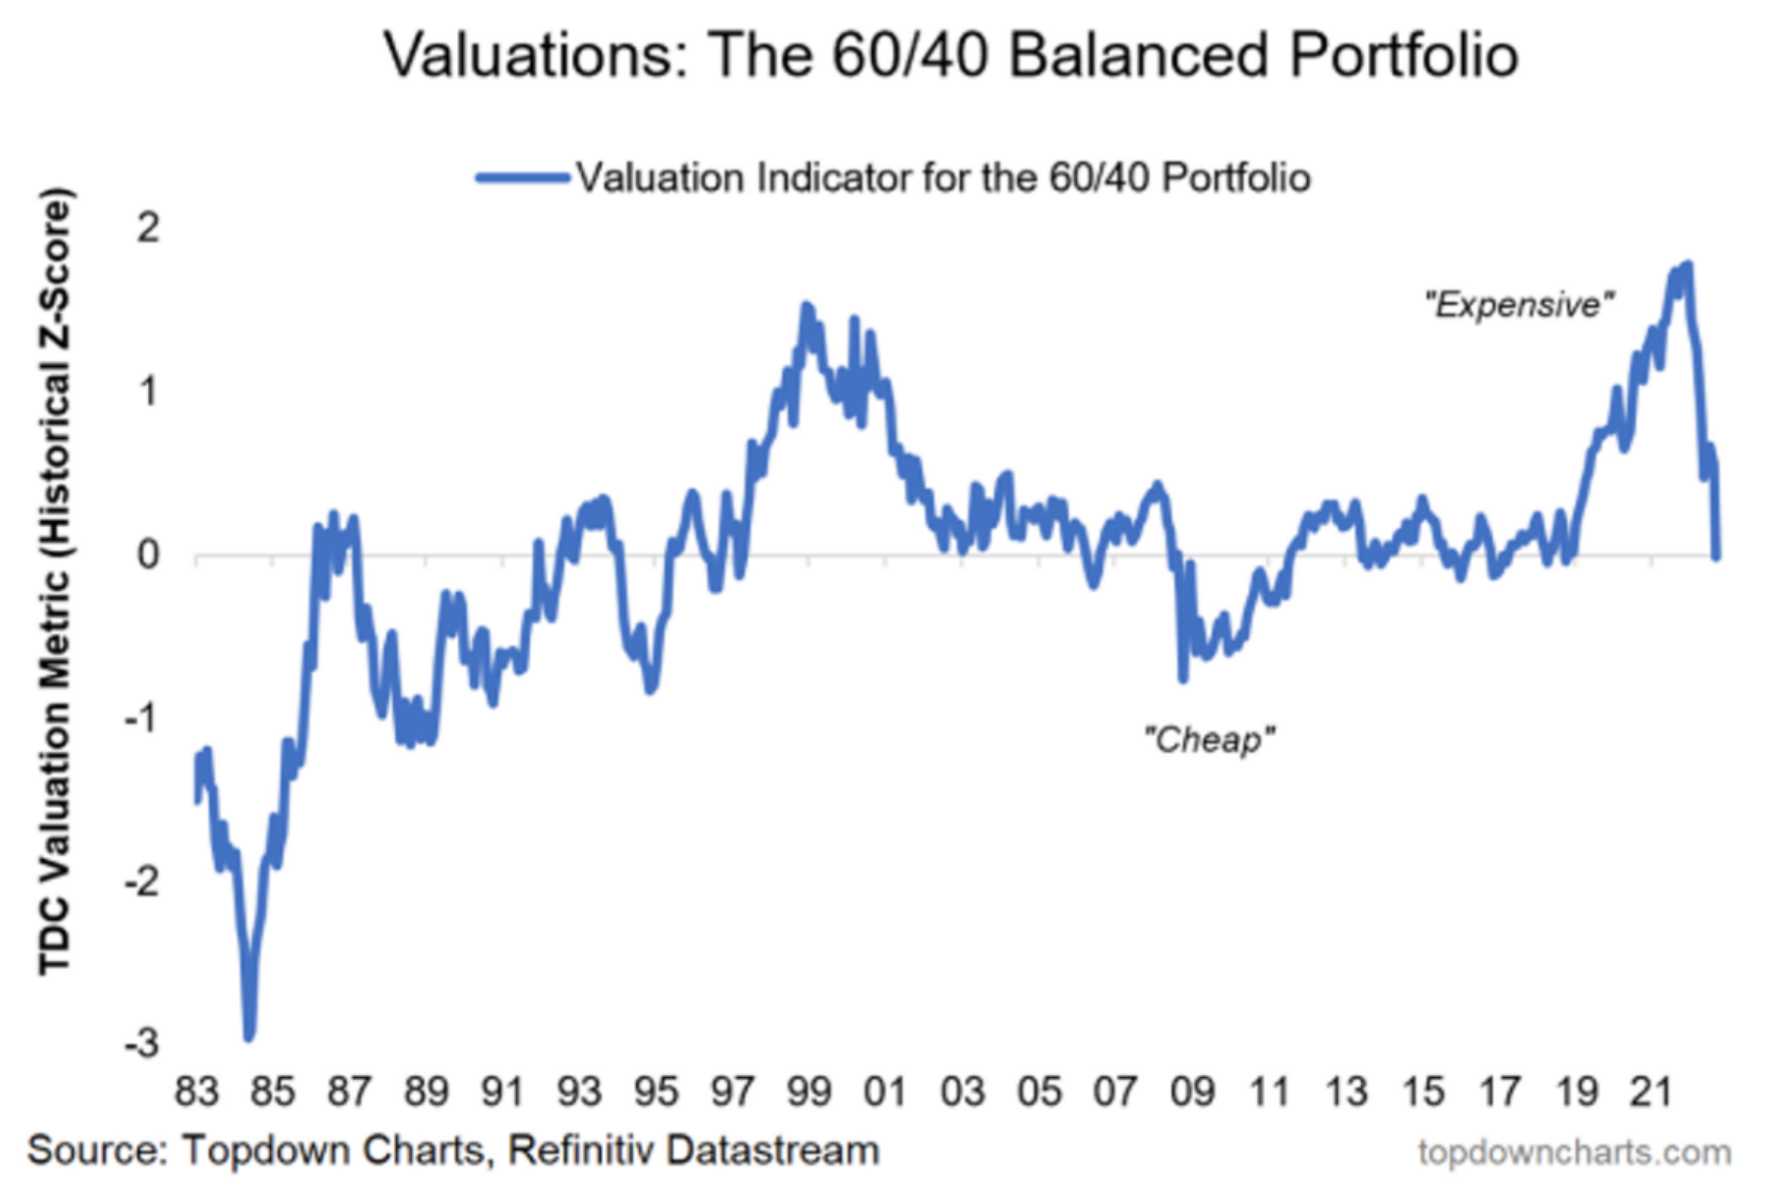
Below the S&P chart is the classic moderate portfolio of 60% stocks and 40% bonds also sitting right in the middle at a 25-year median valuation.
Song by Stealers Wheel
Well, I don't know why I came here tonight
I've got the feeling that something am not right
I'm so scared in case I fall off my chair
And I'm wondering how I'll get down the stairs
Clowns to the left of me
Jokers to the right
Here I am stuck in the middle with you
Yes, I'm stuck in the middle with you
And I'm wondering what it is I should do
It's so hard to keep this smile from my face
Losing control, yeah, I'm all over the place
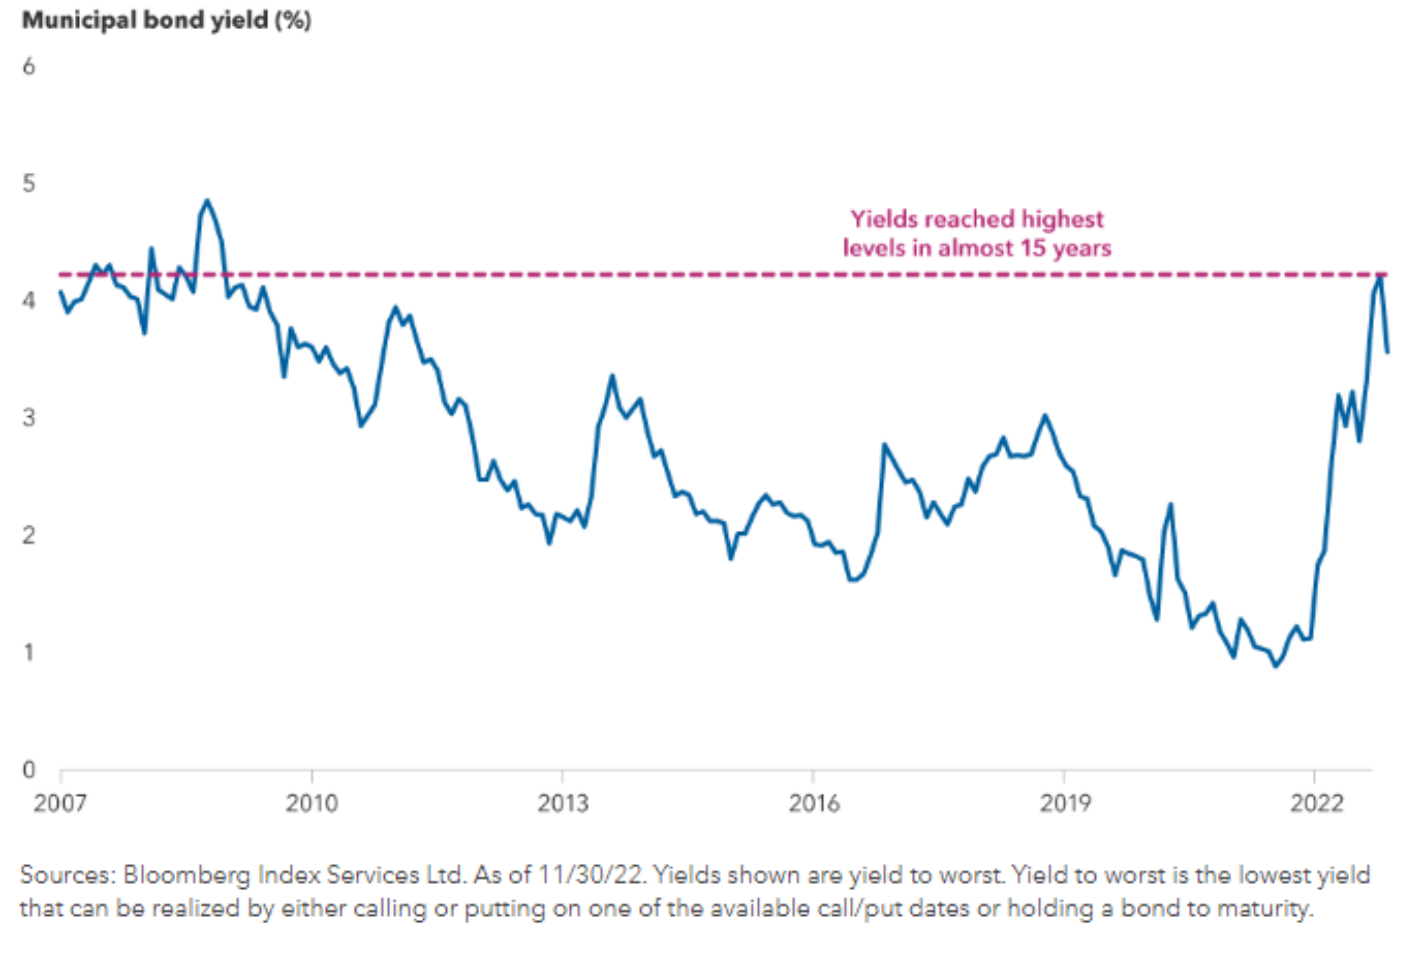
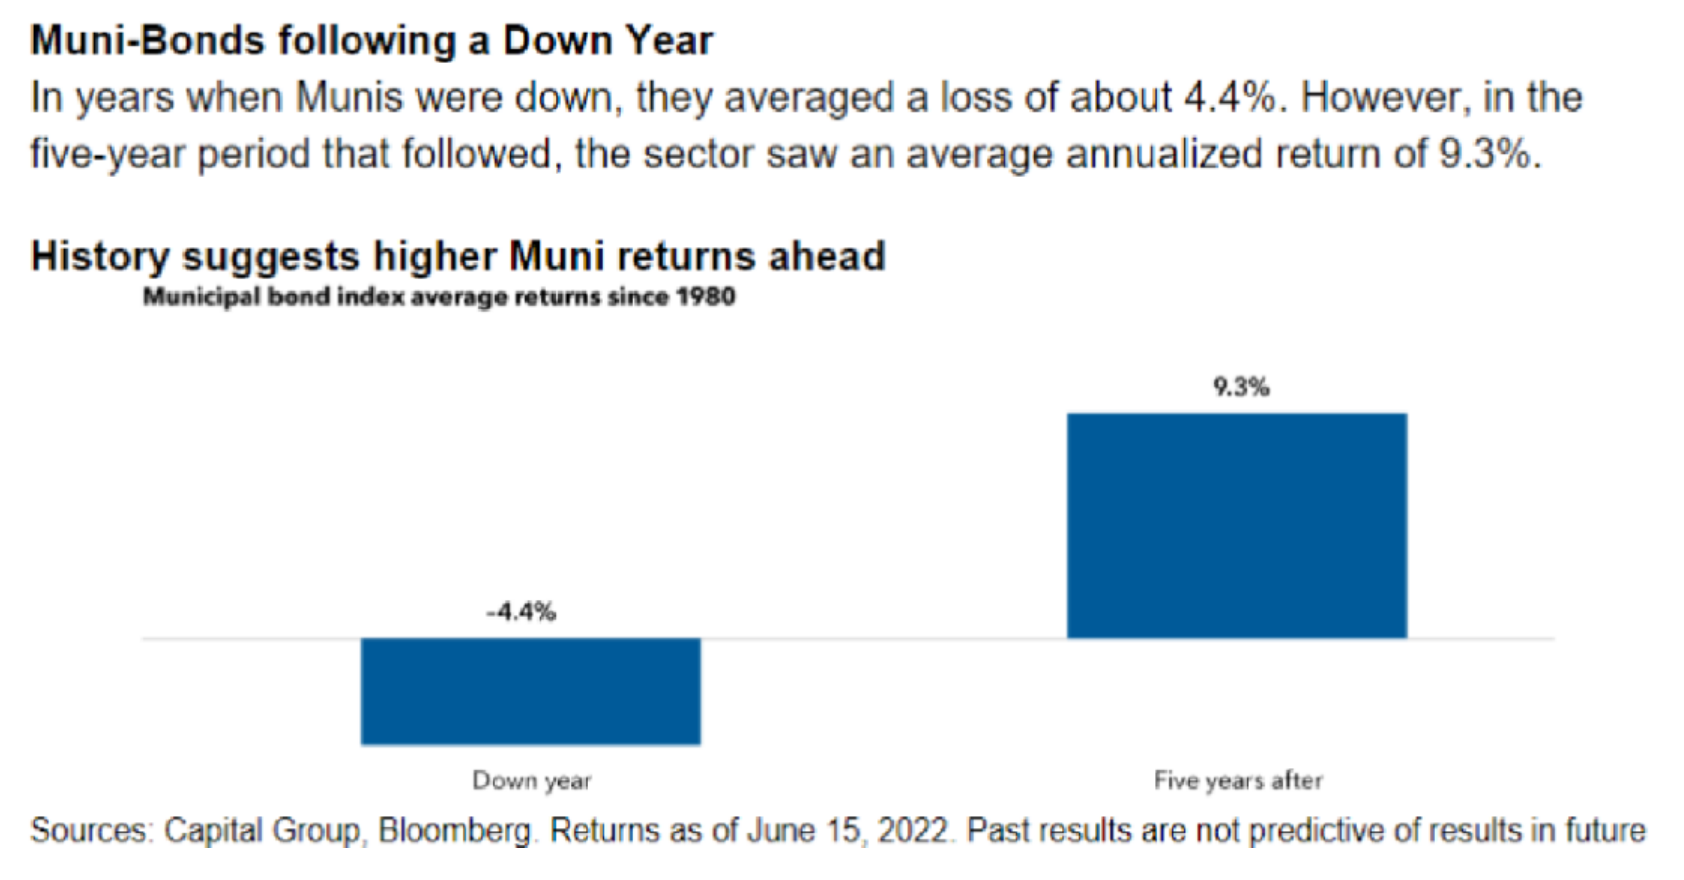
Municipal Bond Yields Reached Highest Level in 15 Years.
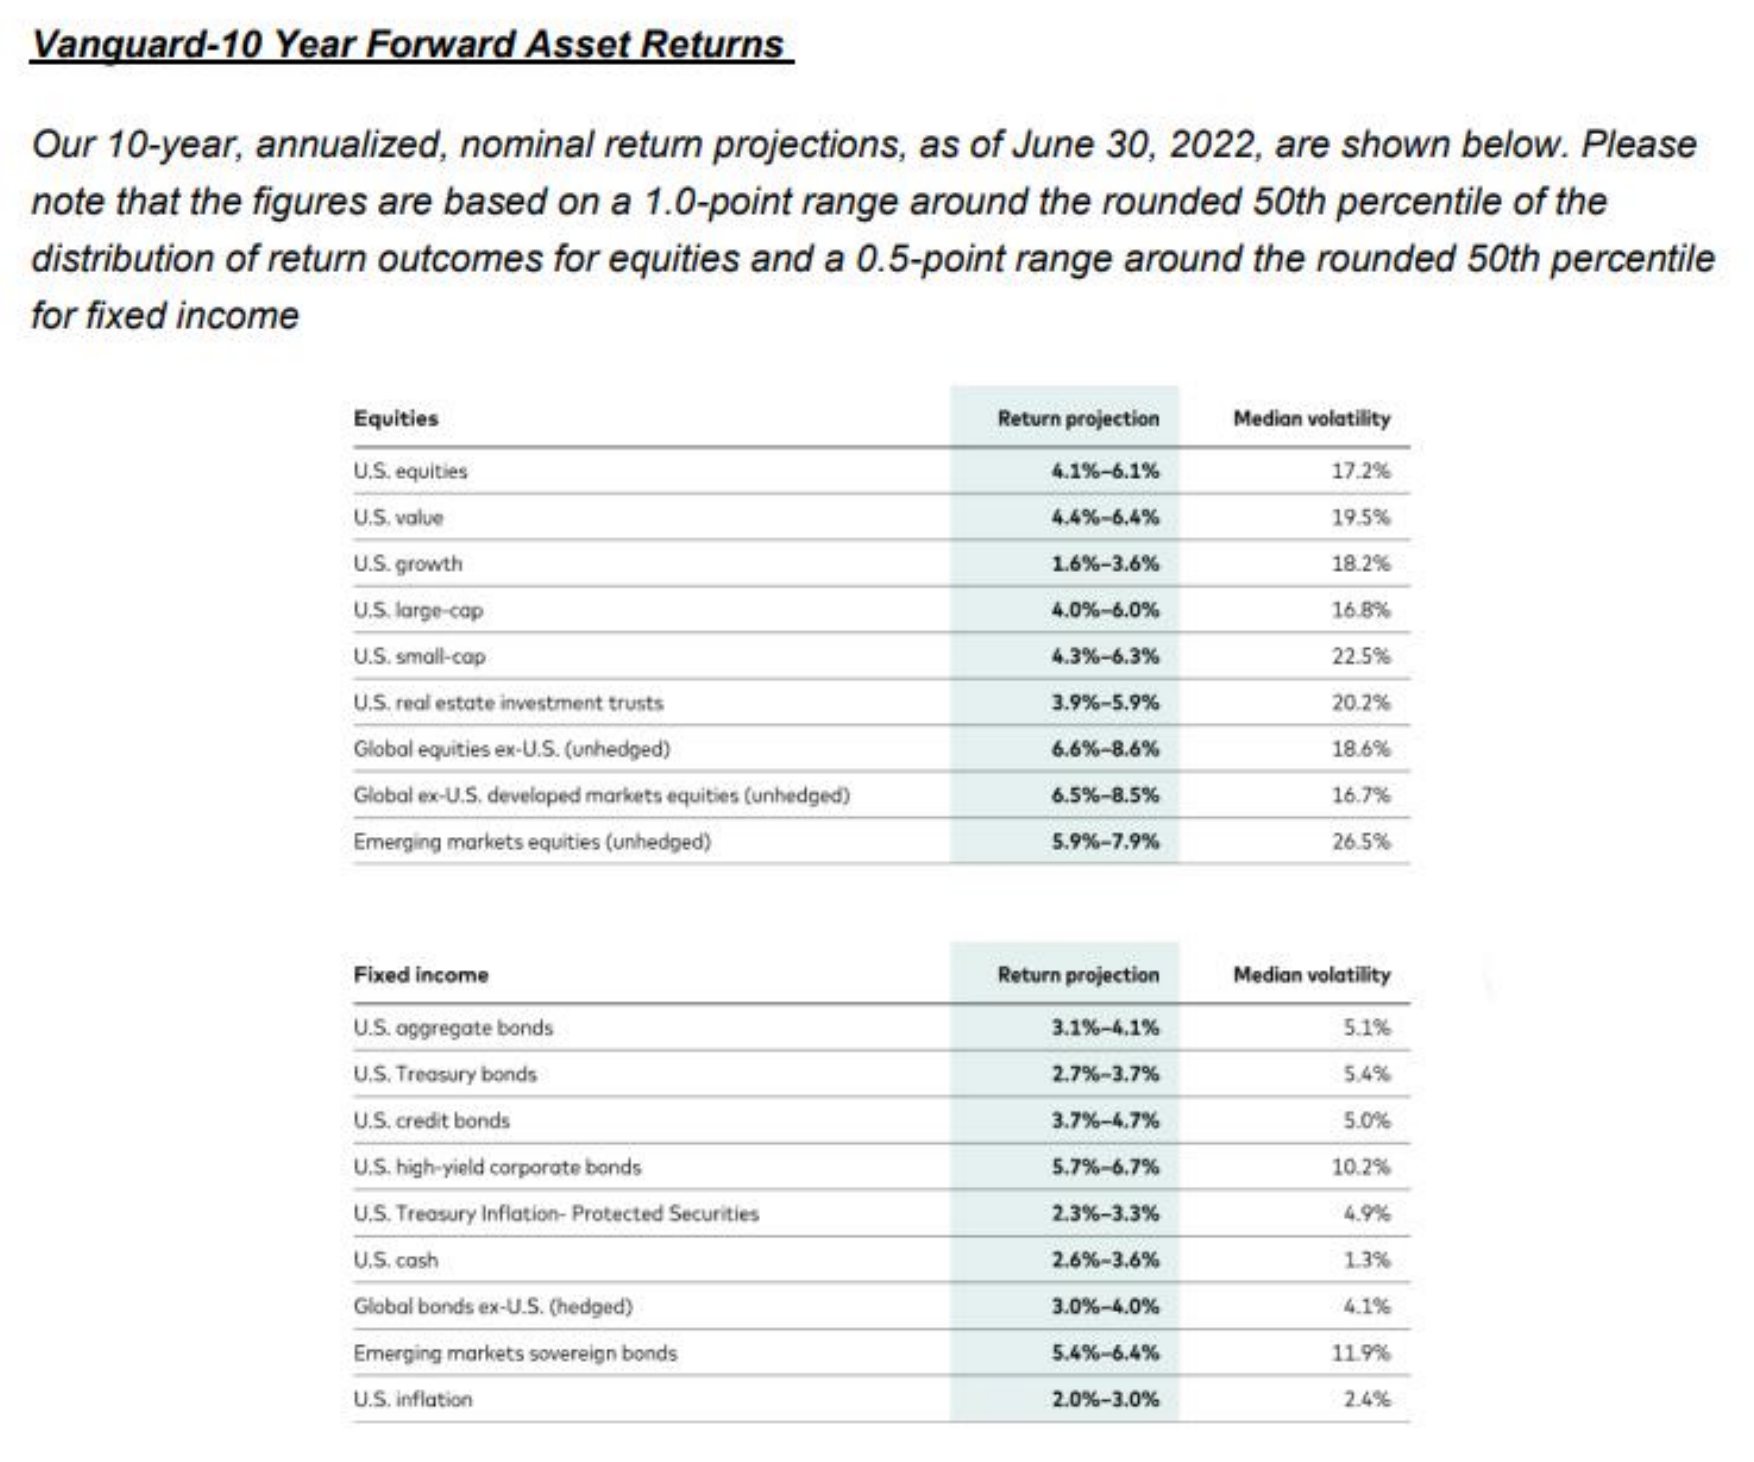
These probabilistic return assumptions depend on current market conditions and, as such, may change over time.
IMPORTANT: The projections and other information generated by the Vanguard Capital Markets Model regarding the likelihood of various investment outcomes are hypothetical in nature, do not reflect actual investment results, and are not guarantees of future results. Distribution of return outcomes from the VCMM are derived from 10,000 simulations for each modeled asset class. Simulations are as of March 31, 2019. Results from the model may vary with each use and over time.
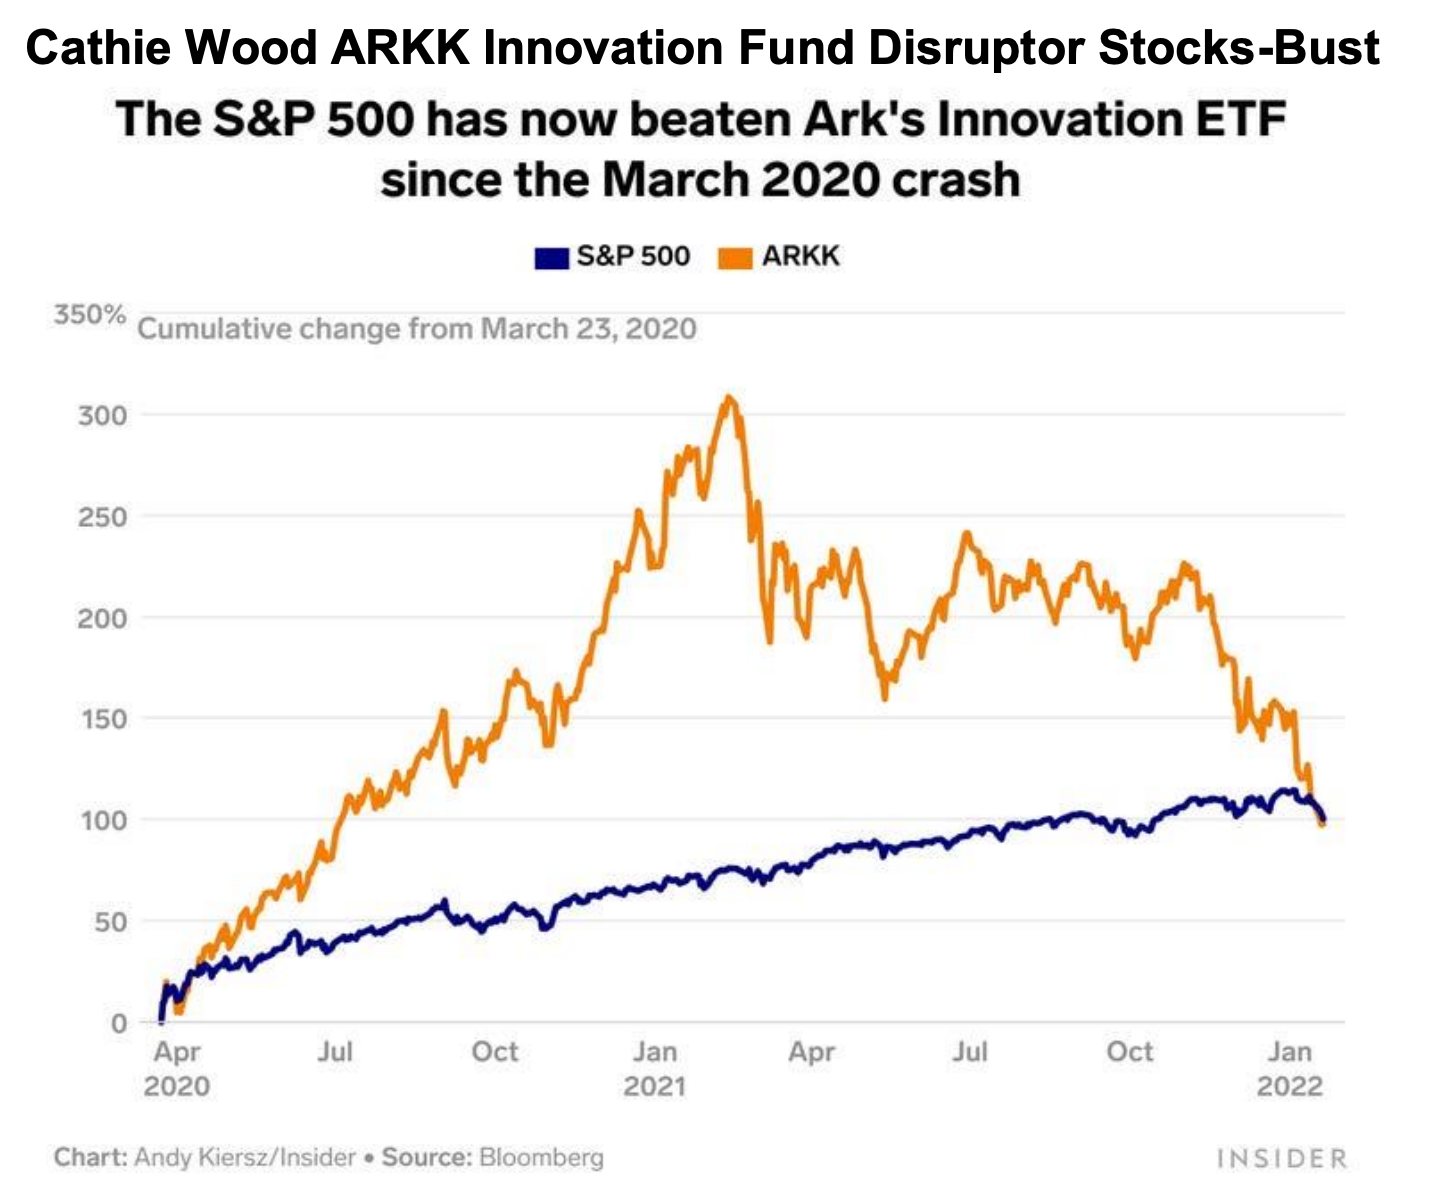
Every bubble has their super stock managers that take on a religious fervor around their stock-picking dexterity. This time around Cathie Wood at ARKK Innovation Fund was hands down the winner. Wood’s funds stamped the name disruptor stocks into the American investing language, but her holdings are down 70% from highs giving back 5 years of gains.
Cathie Wood ARKK Innovation Fund Disruptor Stocks-Bust
On December 7th, 1999, Barron’s published the infamous “What’s Wrong,Warren” cover eerily before the Nasdaq crashed 50% and Berkshire recovered years’ worth of underperformance.
The below graph plots the time period 6/30/98 through 2/29/00 for the Nasdaq where many dot-com and technology stocks traded, and the price of Berkshire Hathaway, Warren Buffett’s holding company, which consisted of value stocks:
Third
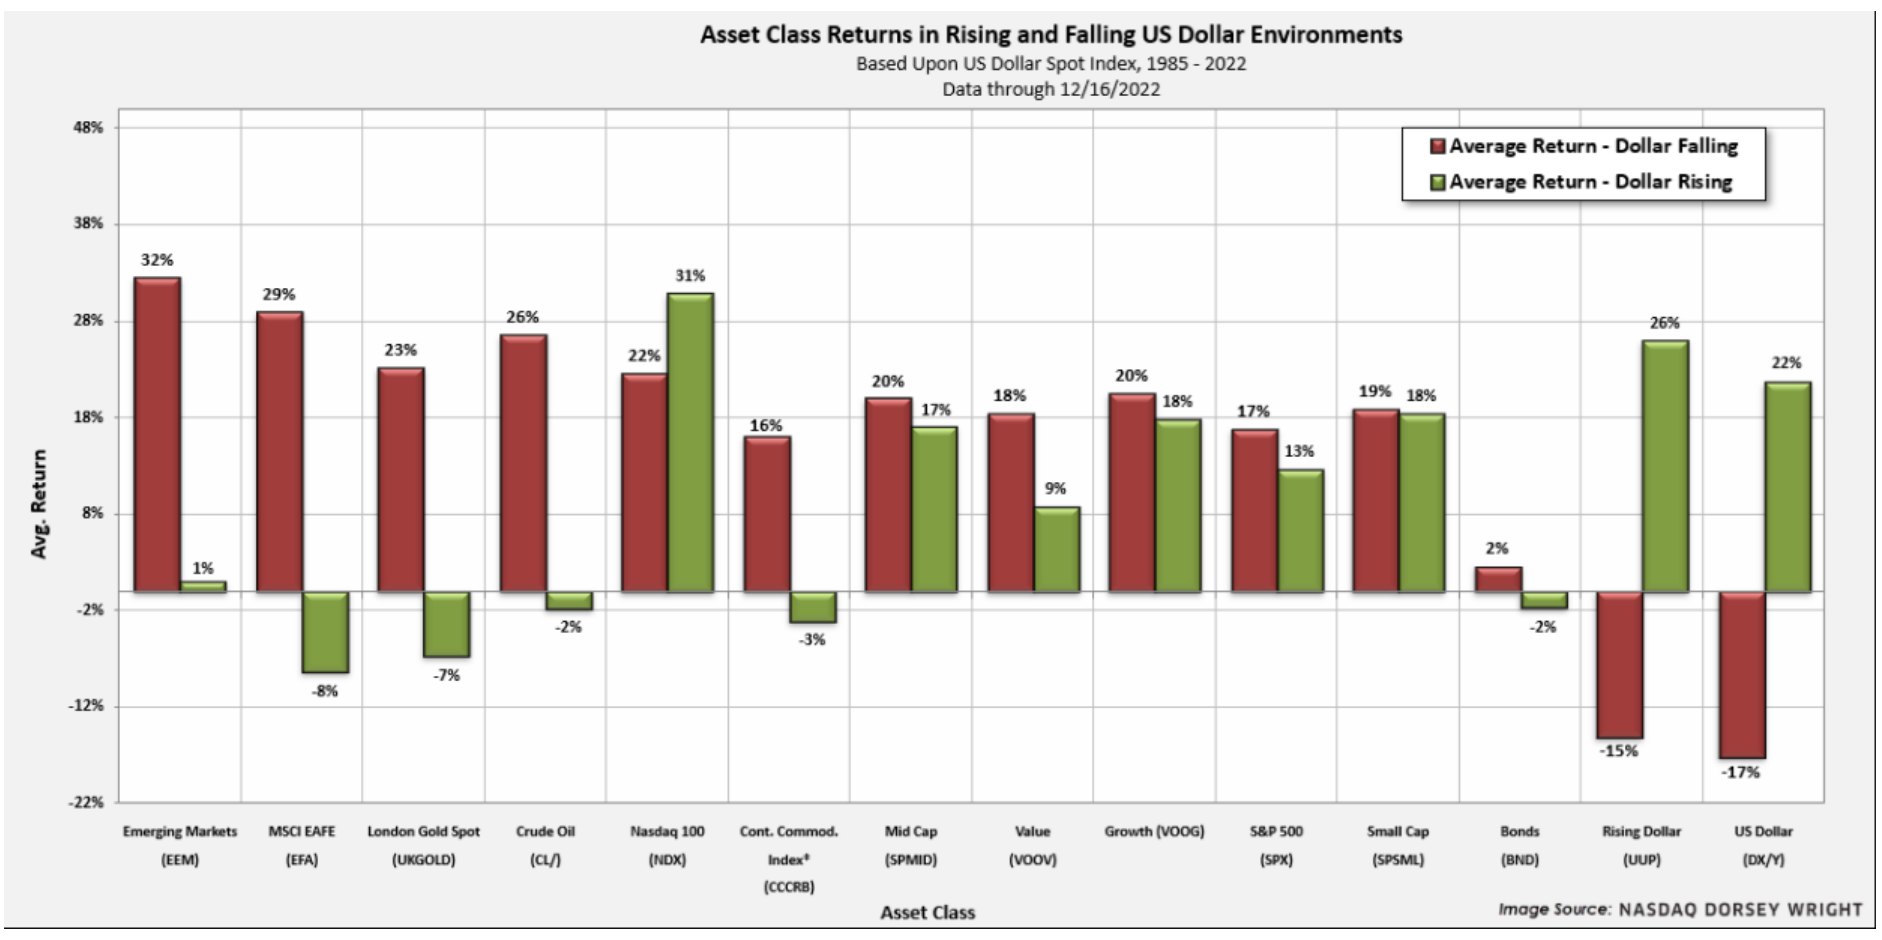
, the U.S. dollar is showing weakness for the first time in 8 years. As presented in the chart below, a weak dollar environment changes the dynamics of asset class returns.
Part II - The Fed Popped the Bubbles
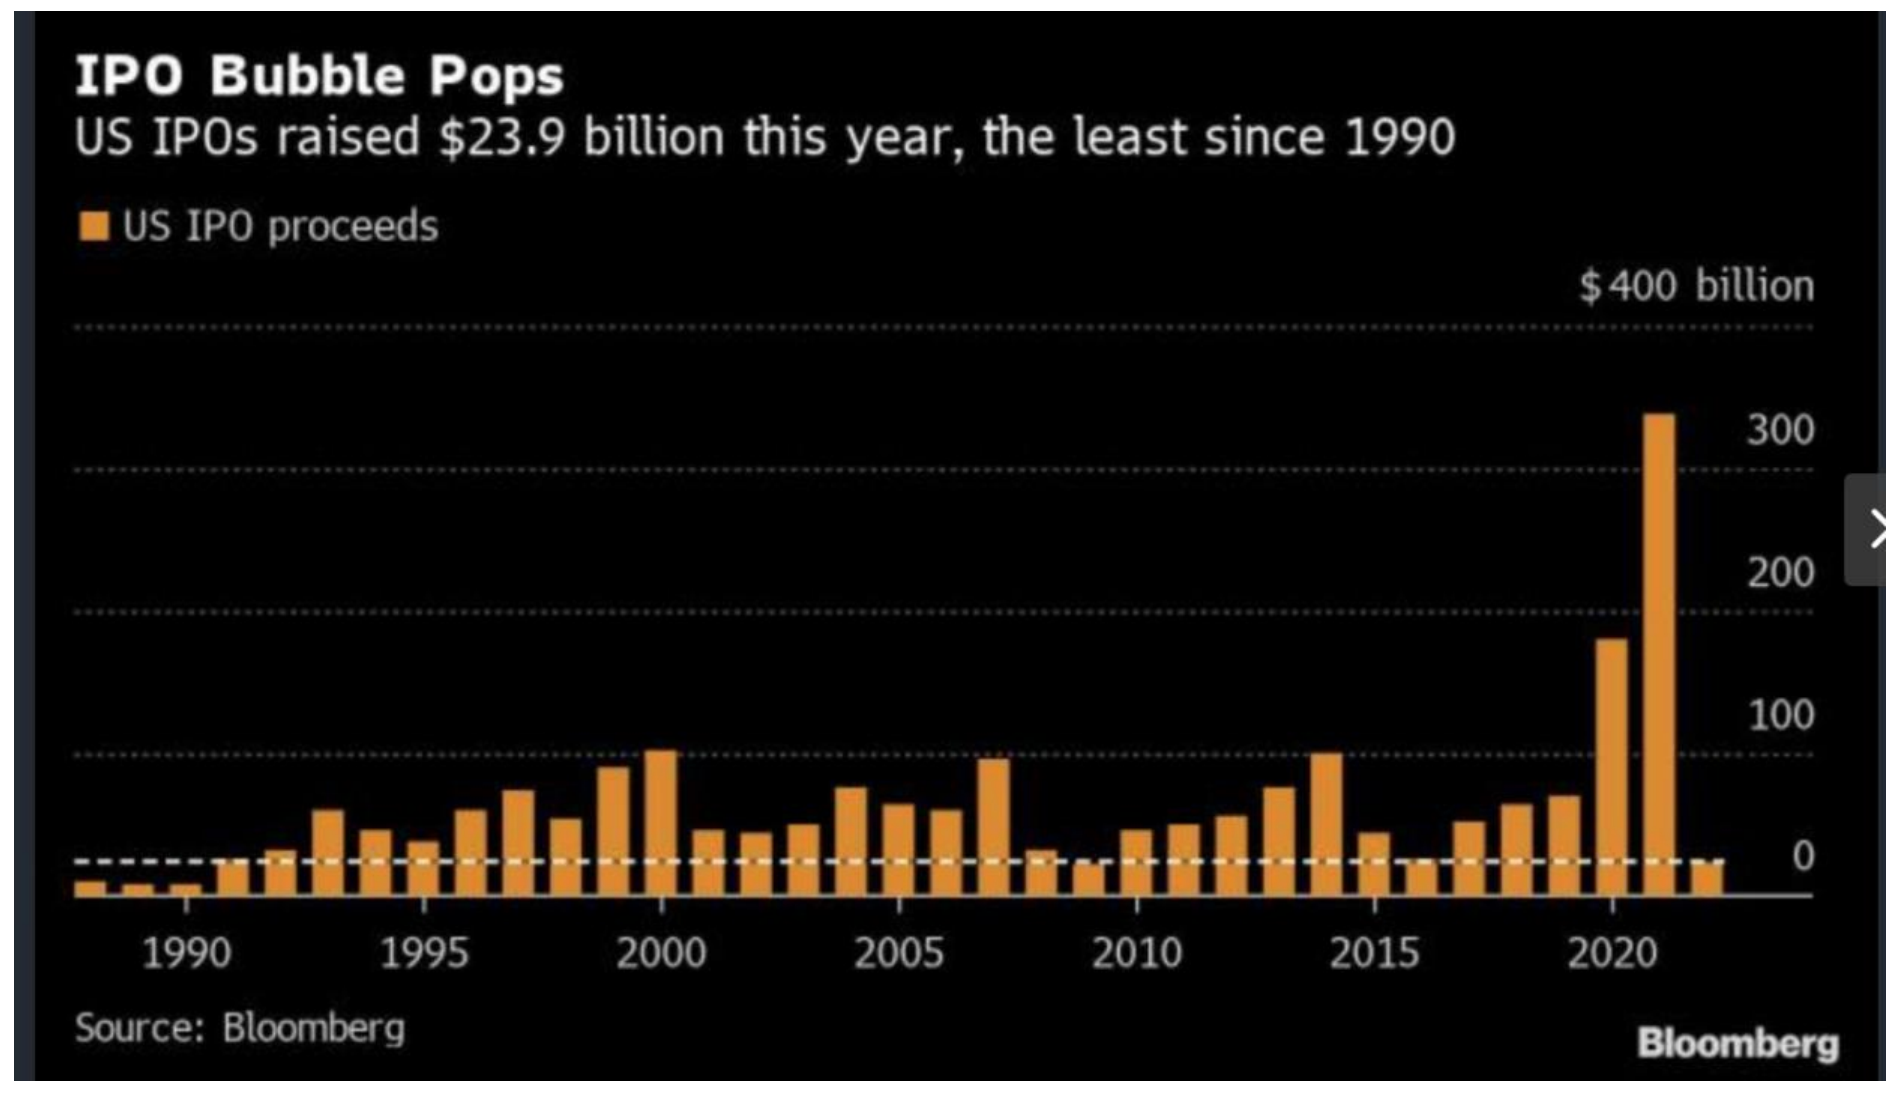
The last years of the bull market took on the title of “the everything bubble.” Well the Fed burst most of those bets - IPO, SPAC, Disruptor stocks, Crypto, and FAANG+.
IPO Market Boom to Bust - IPO Market Raises Least Amount of Money Since 1990-Initial Public Offerings in Stock Market
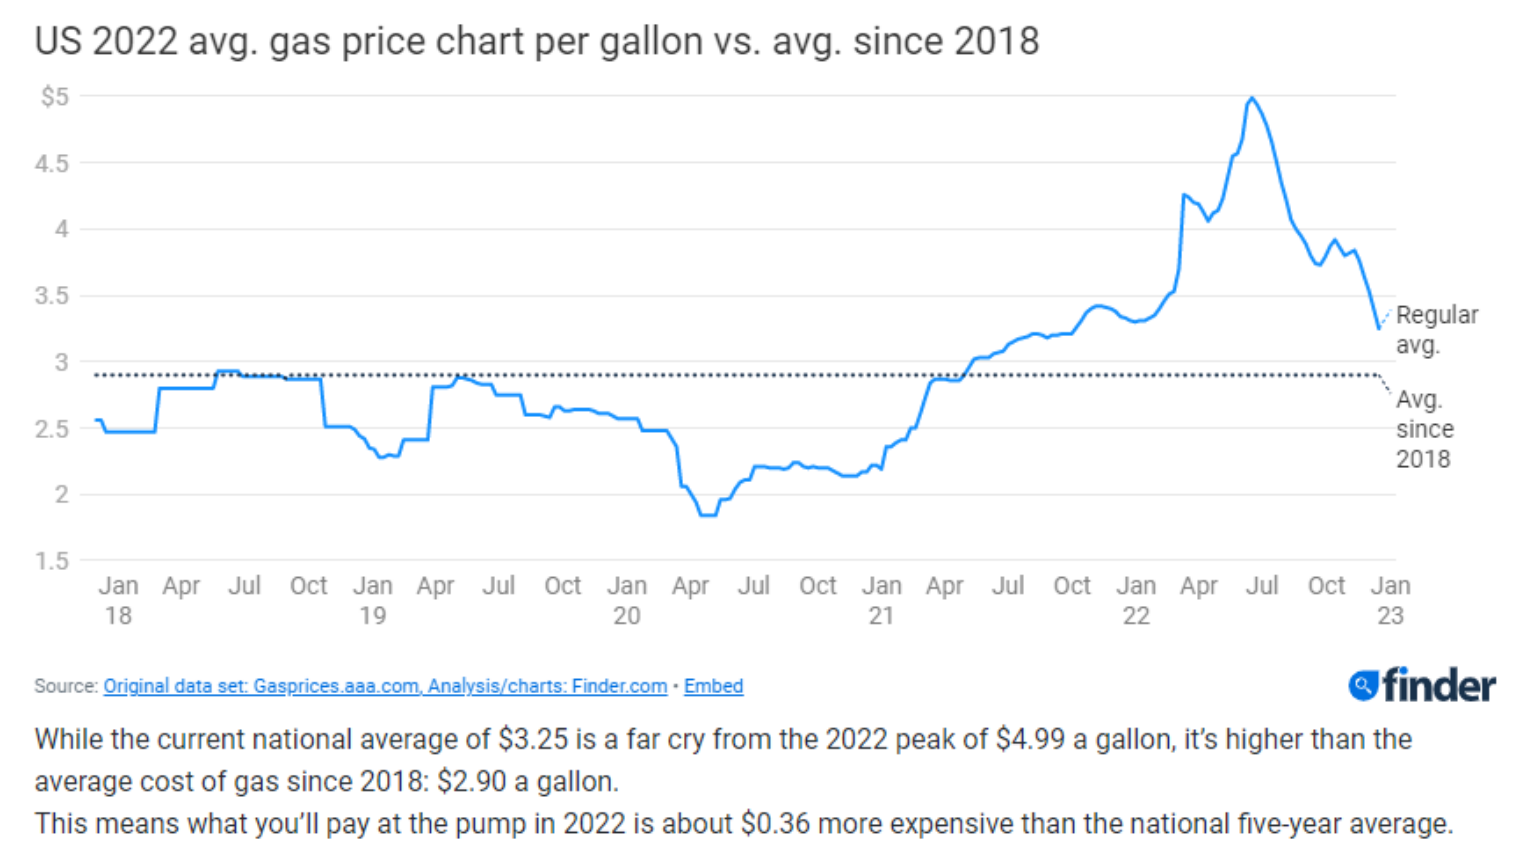
Gasoline prices at the pump are reverting to the 5-year mean. This oil intensity data is not even counting the U.S. shale boom that could leave our nation a net oil exporter in 2023. To put things in perspective, the price of natural gas in Europe is down -70% from highs at the start of the Ukraine invasion.
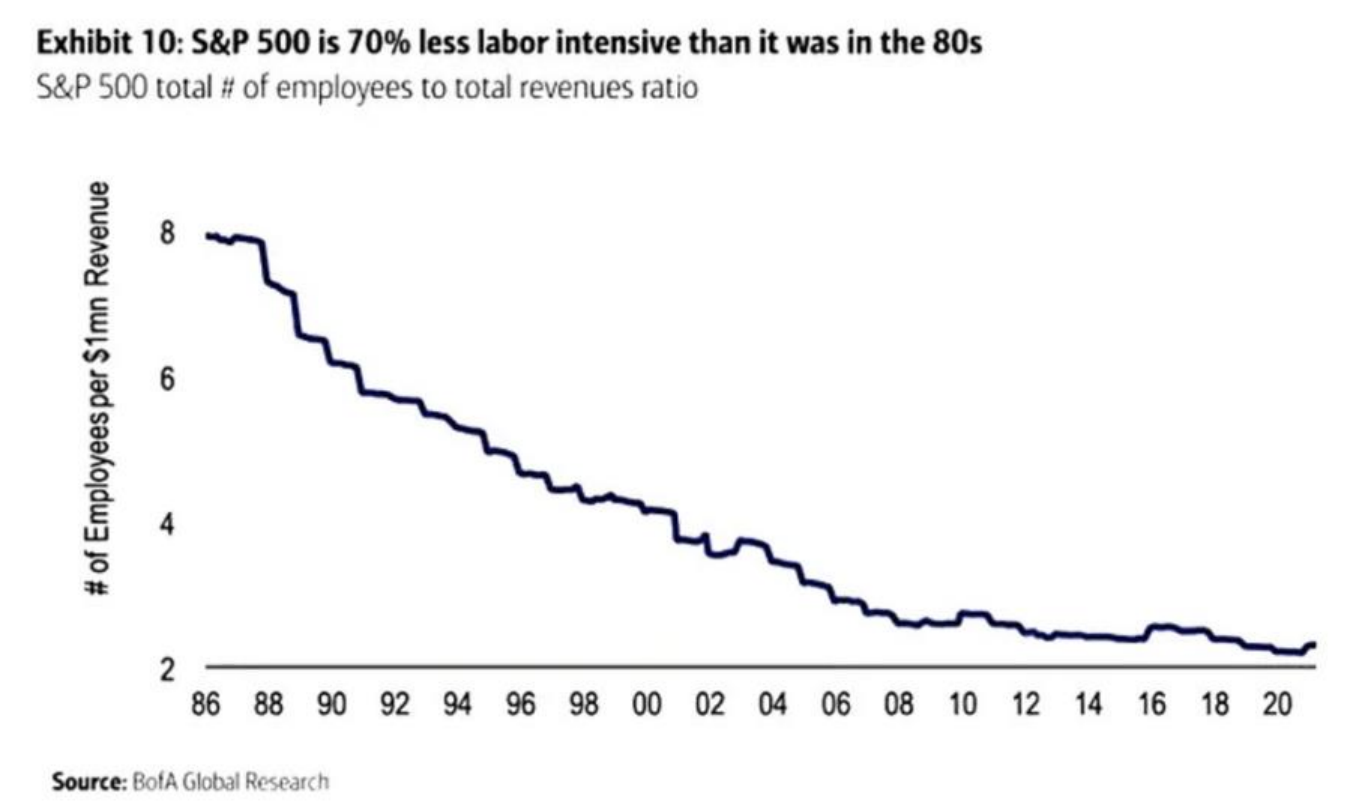
Labor Intensity of S&P 500 Down 70% Since 1980
This is a stunning statistic but due to technology, labor intensity of the S&P 500 has collapsed. "In 1986, it took 8 employees to generate US$1 million in revenue. Today, the S&P 500 is 70% less labor intensive than it was in the 80s” This is not counting the robot revolution coming to the world economy.
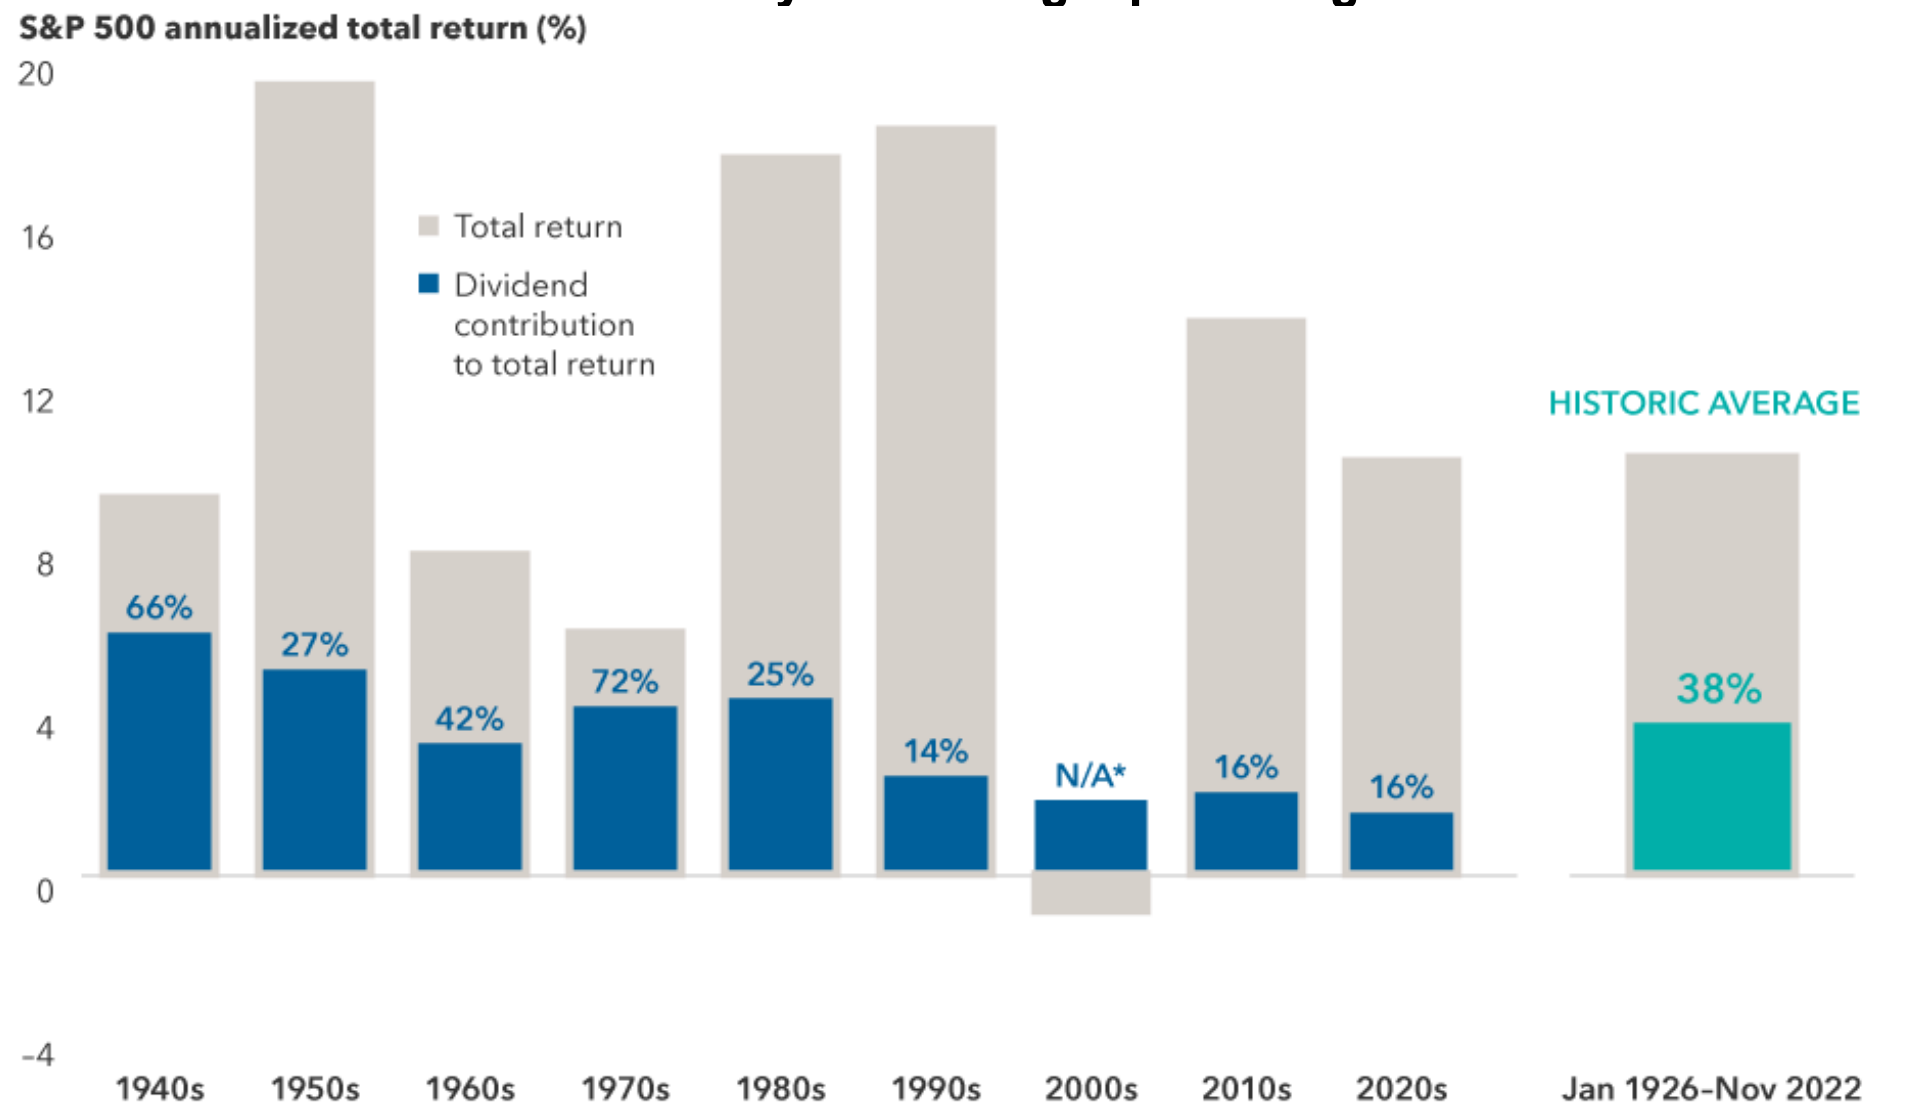
Source: S&P Dow Jones Indices LLC. 2020s data is from 1/1/26 through 11/30/22. *Total return for the S&P 500 Index was negative for the 2000s. Dividends provided a 1.8% annualized return over the decade. Past results are not predictive of results in future periods.
From Jack Ablin, Cresset Capital
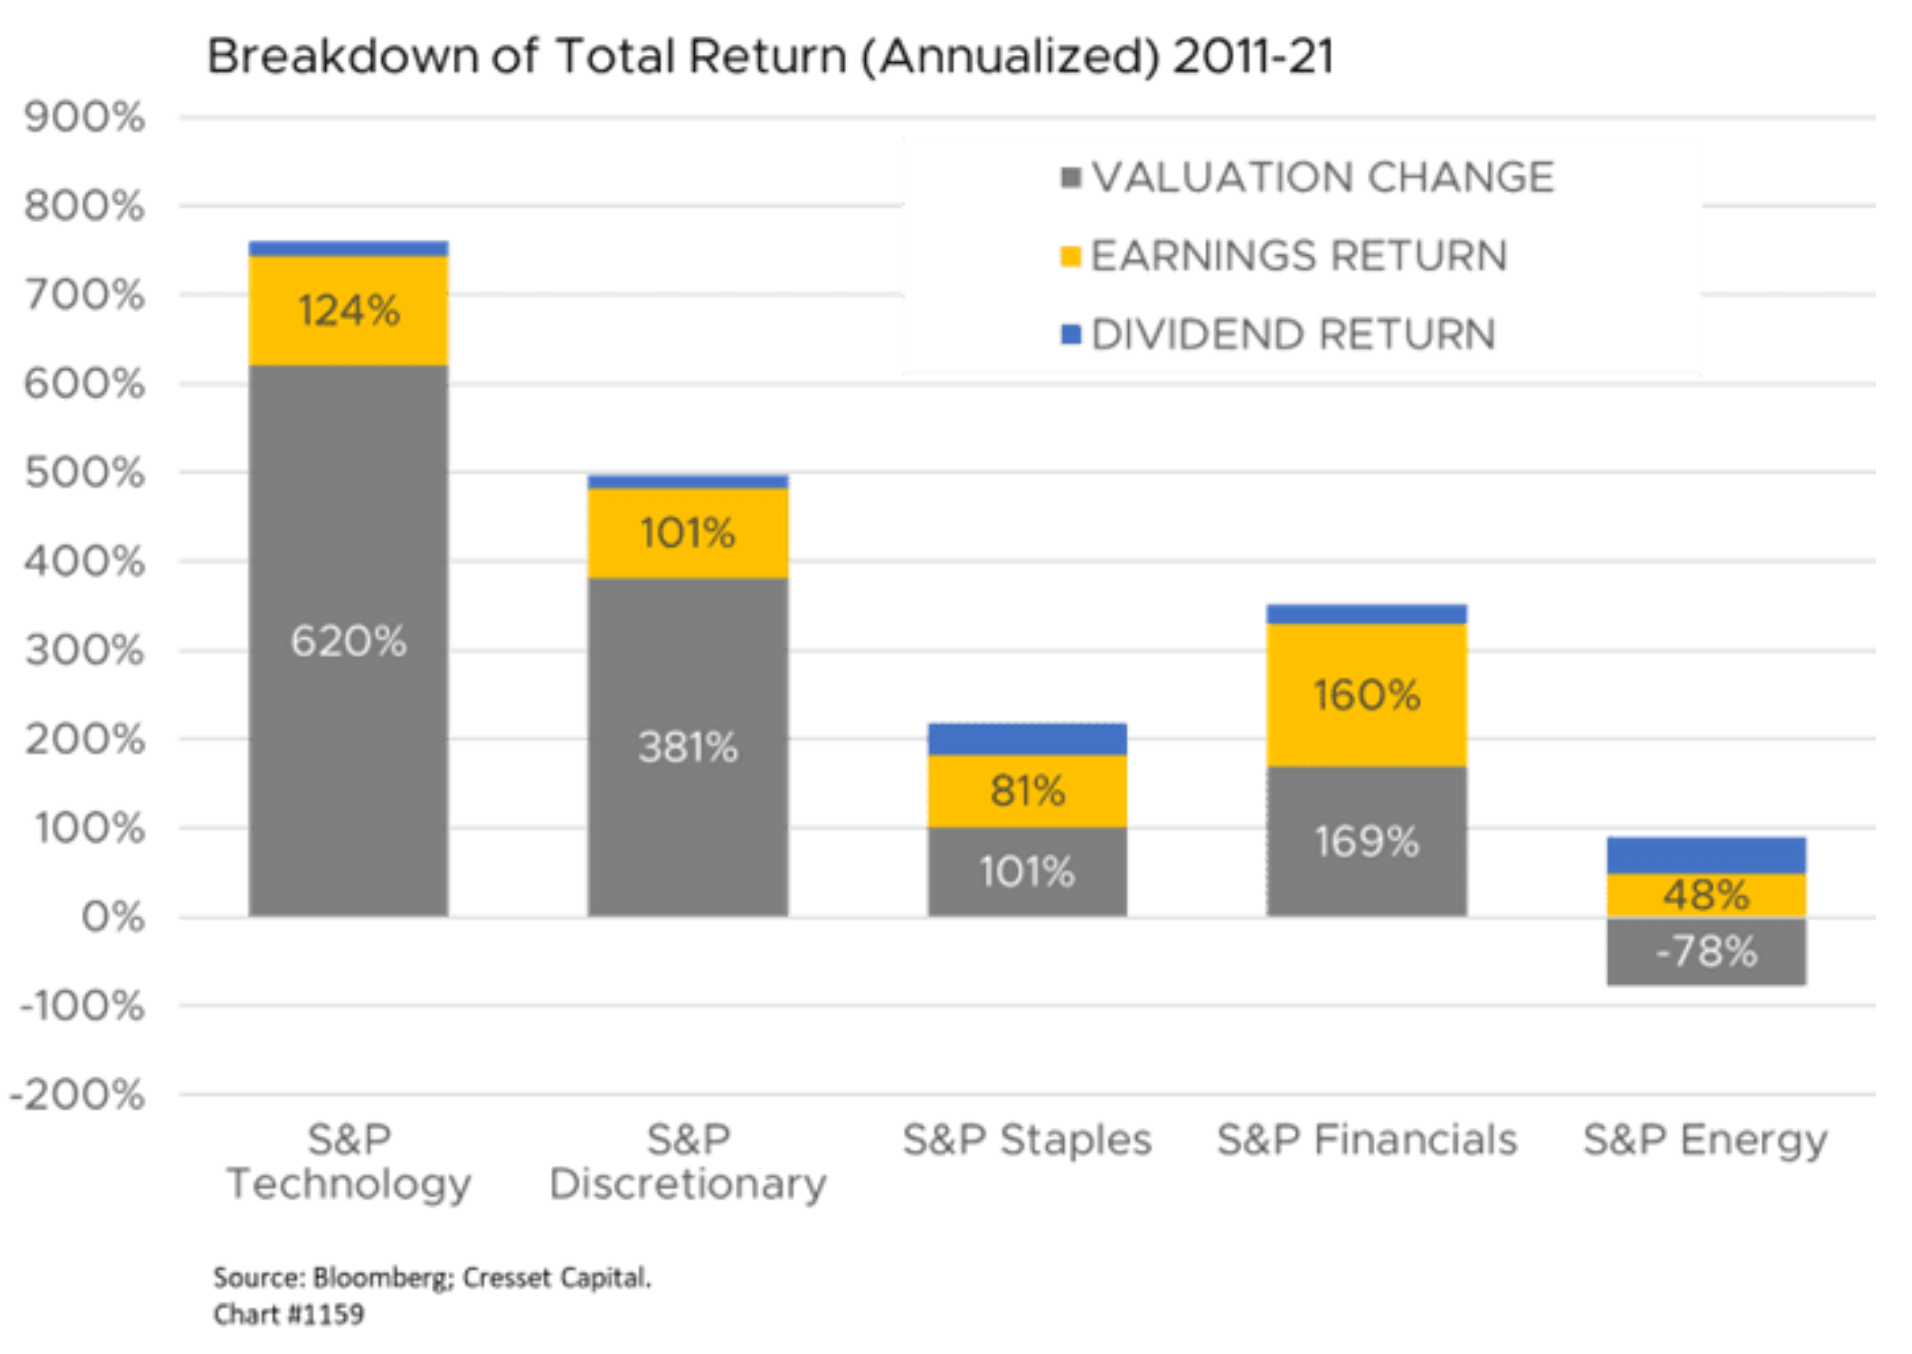
- Between 2011 and 2021, the technology sector delivered a cumulative 760 percent return to investors, or about 24 percent annualized. Of that, 620 percentage points was attributable to valuation expansion, leaving 140 percent, or about 9.1 percent annualized, attributable to earnings growth and dividend yield. As we have pointed out repeatedly in our research, it’s unlikely investors will have the luxury of valuation expansion over the next 10 years.
https://cressetcapital.com/post/q3-earnings-will-show-damage-from-rates-inflation-dollar/
Second , bonds will act like bonds again giving us a cash buffer, reasonable coupon, and lowering the overall volatility of investors’ capital markets portfolios. In 2022, this did not happen as we had zero coupon return and bonds followed stocks down double digits.
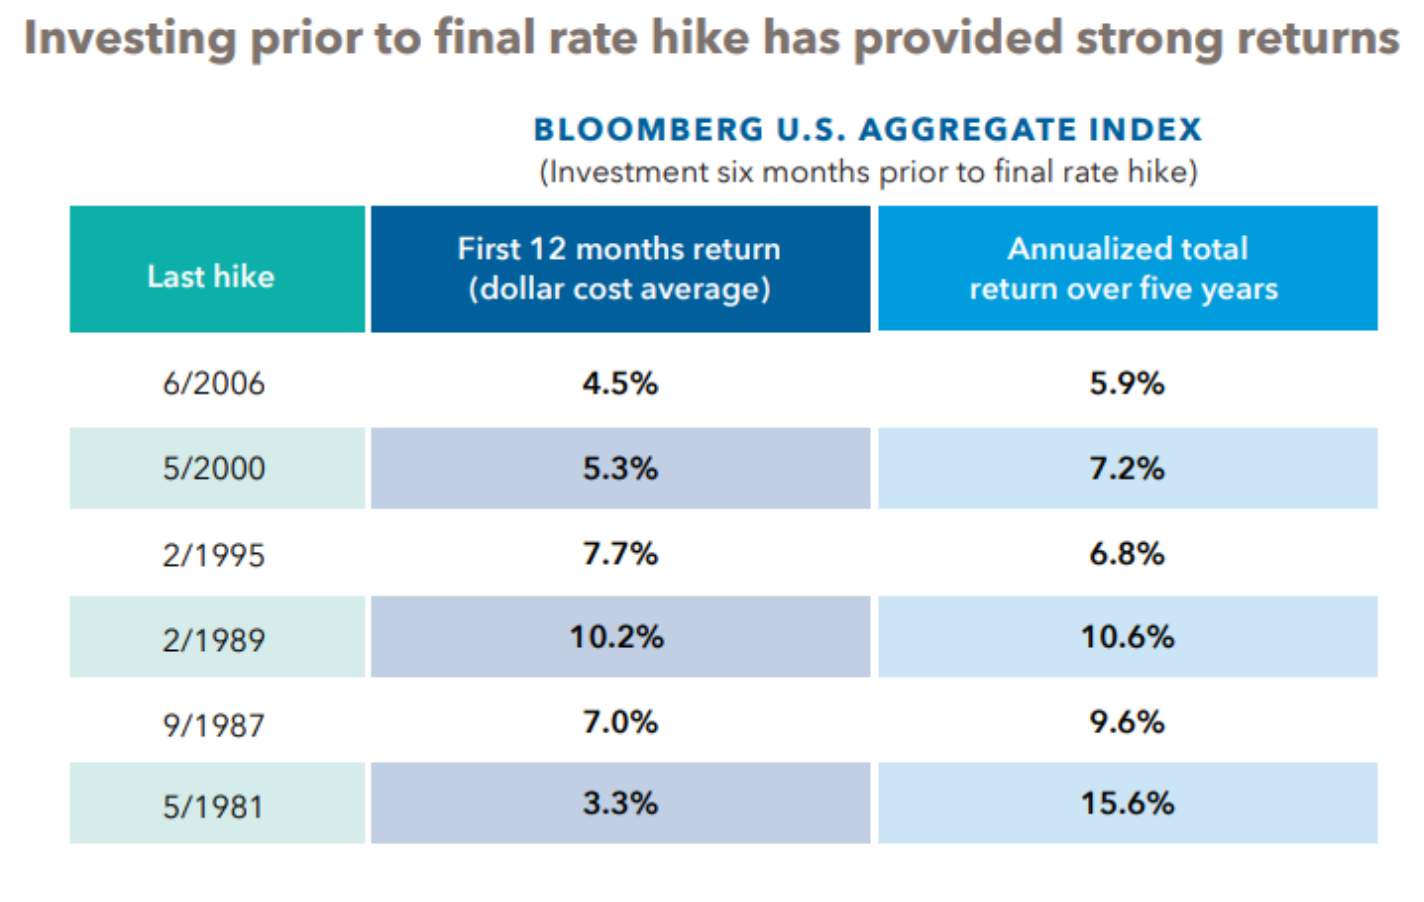
The good news for bond investors is that investing prior to the final rate cut, which we assume comes in the first half of 2023, has been a high-probability bet.
Leveraged loans are up 50 percent since 2015
Leveraged loans, which are issued by overleveraged companies with insufficient cash flows, are part of what Wolf Richter recently called the “gigantic pile of risky corporate debt that is now being brutally repriced as concerns over credit risk (the risk of default) are finally bubbling to the surface.” According to Richter, the S&P/LSTA US Leveraged Loan 100 Index, which tracks the prices of the largest leveraged loans, has plunged by 20 percent since February 22nd.
According to Richter, leveraged loans “are traded in slices like securities or are packaged into highly rated Collateralized Loan Obligations (CLOs). But for years, investors had the hots for them, driven by their relentless chase for yield, in a world of interest rate repression.”
These companies, noted Richter, were often acquired by private equity firms through leveraged buyouts, which means they loaded up those companies with lots of debt. In addition, “PE firms extracted special dividends from their companies,” which were funded by leveraged loans. That’s a form of asset stripping and it leaves the company “more leveraged, more precarious and more likely to topple. But who cares? Those were the good times and the chase for yield was on,” lamented Richter.
The FAANG Plus Stock Phenomenon
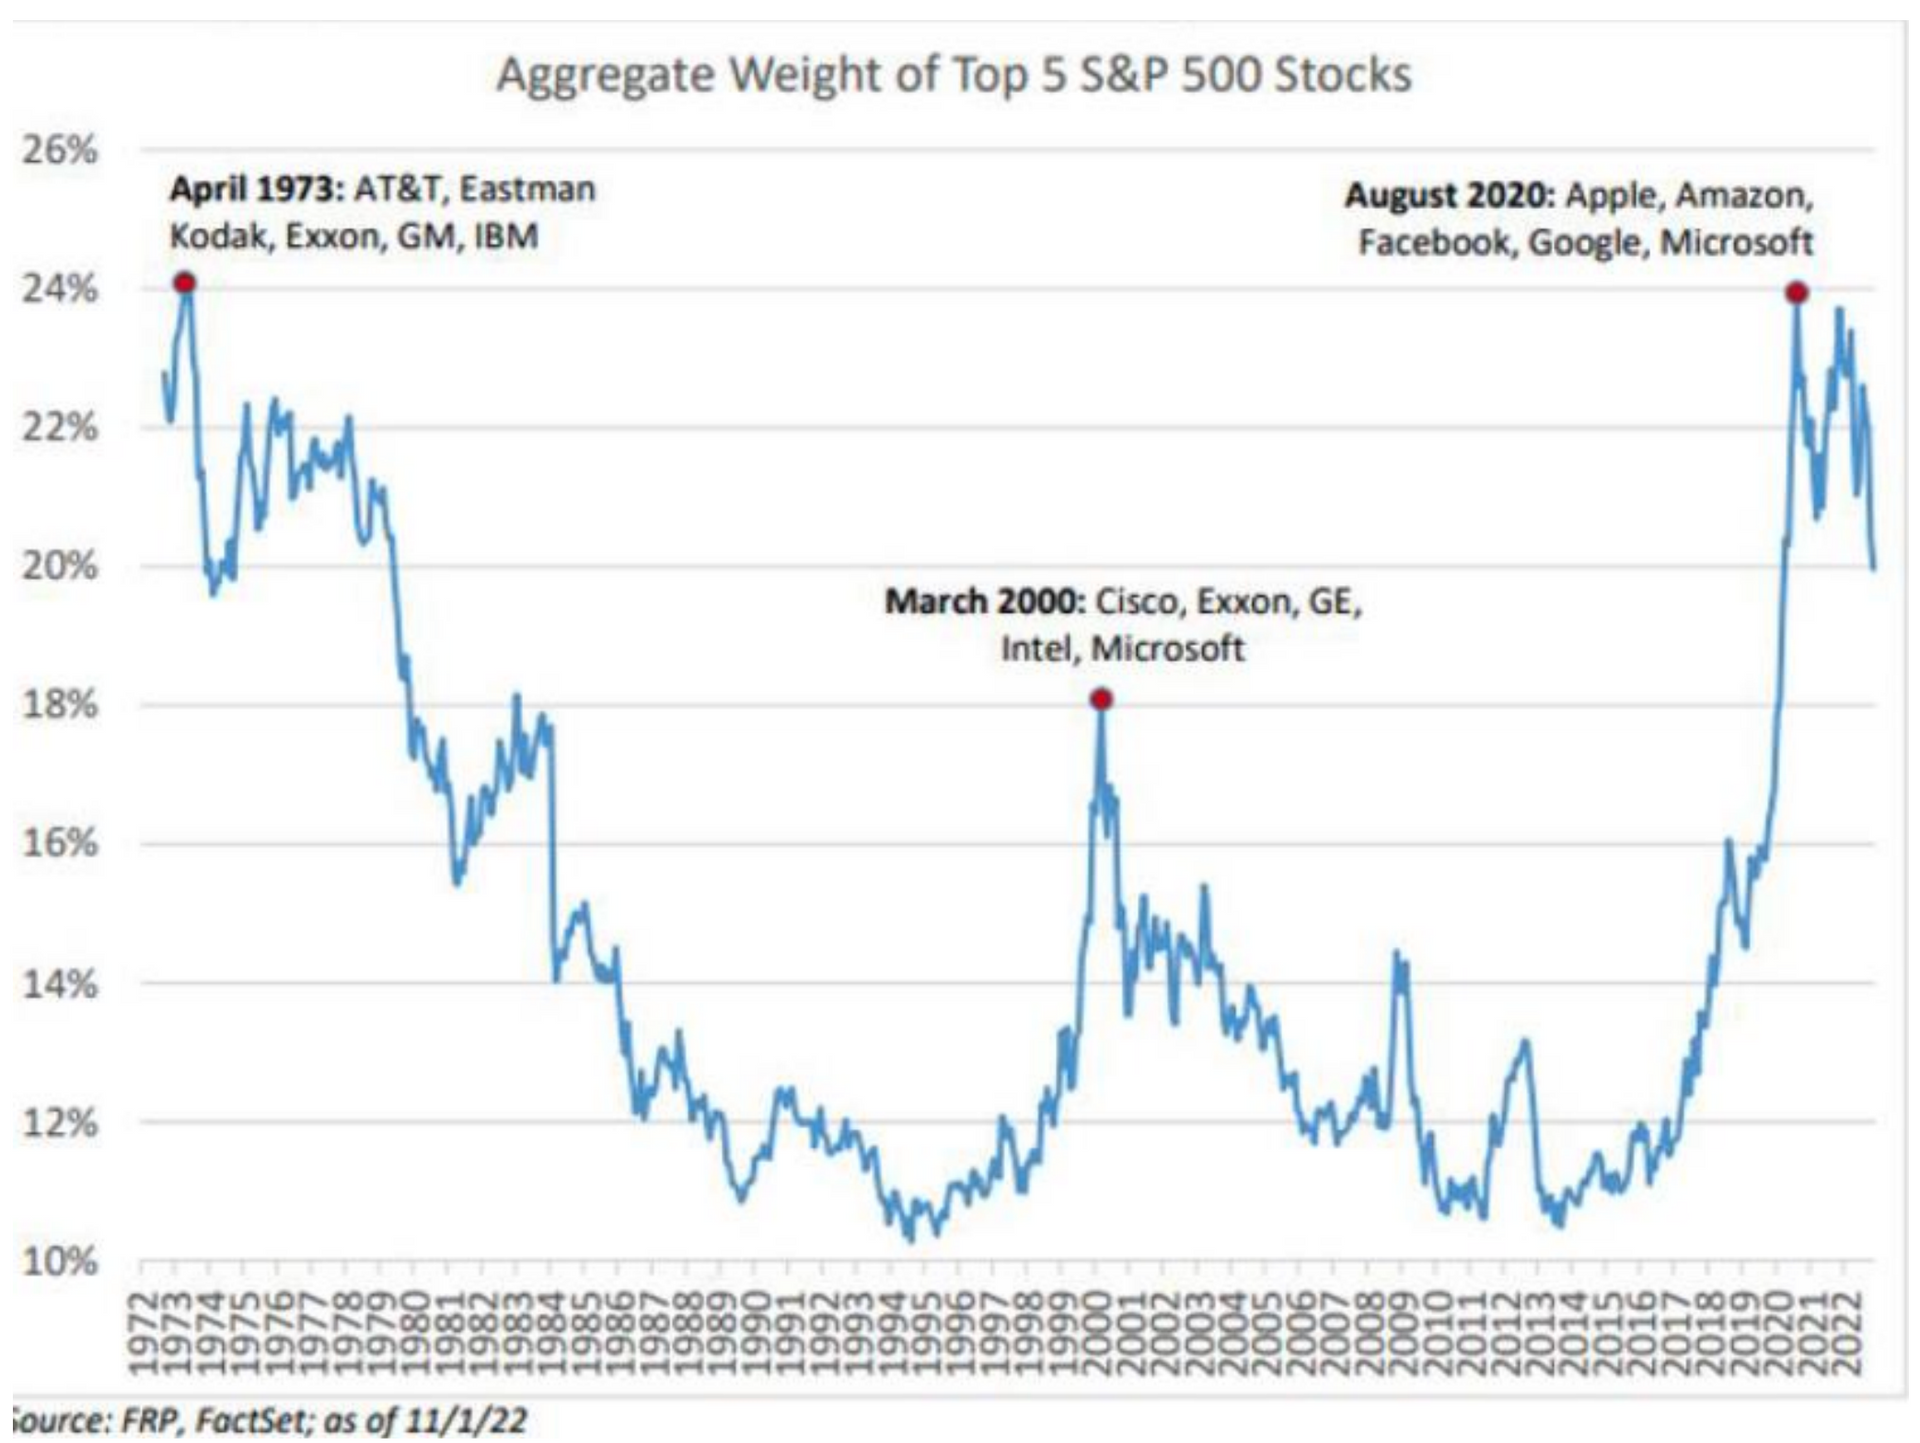
This bull market is not the first time there has been a concentration in the S&P market cap. As you can see on the chart, this oversized weighting of 5 stocks has happened two other times in modern market history - both were followed by decades of underperformance. If you think Crypto's $2 trillion wipeout was bad, eight popular tech stocks lost $4.8 trillion of value.
Barron’s - On a combined basis, eight popular tech stocks— Apple (ticker: AAPL), Microsoft (MSFT), Alphabet (GOOGL), Tesla (TSLA), Nvidia (NVDA), Meta Platforms (META), Amazon.com (AMZN), and Netflix (NFLX)—collectively lost $4.8 trillion in market cap, roughly equal to the annual GDP of Japan—and 40% of the combined valuation of those eight stocks at the start of the year. Apple was the best performer, losing a quarter of its value in 2022. Amazon, whose valuation fell below $1 trillion, declined 49%, shedding more than $825 billion.
The chart below shows the spike during Covid that sent FAANG+ stocks to a higher valuation than Internet large-cap darlings topping out at the exact level of 1973 leaders. This is one to watch because retail investors are still buying these popular stocks - but remember my last letter that CSCO and INTC never made it back to 1999-2000 highs.
Part III - What Comes Next?
First, huge capital gains in stocks due to low-interest rates and growing revenue while losing money on the bottom line, is over. Keep in mind that tech stocks did not bottom until 3 years after the internet bubble popped. This leaves us with options for the safety of principal and a reasonable rate of return.
Reversion to Mean…Dividends Historic Average vs. 2010-2020
Capital Group -While dividends accounted for a slim 16% of total return for the S&P 500 in the 2010s, historically they have contributed an average 38%. In the inflationary 1970s they climbed to more than 70%. “When you expect growth in the single digits, dividends can give you a head start,” Wagner adds. “They may also offer a measure of downside protection when volatility rises, but it is essential to understand the sustainability of those dividends.”
Dividends have historically been a larger percentage of total return
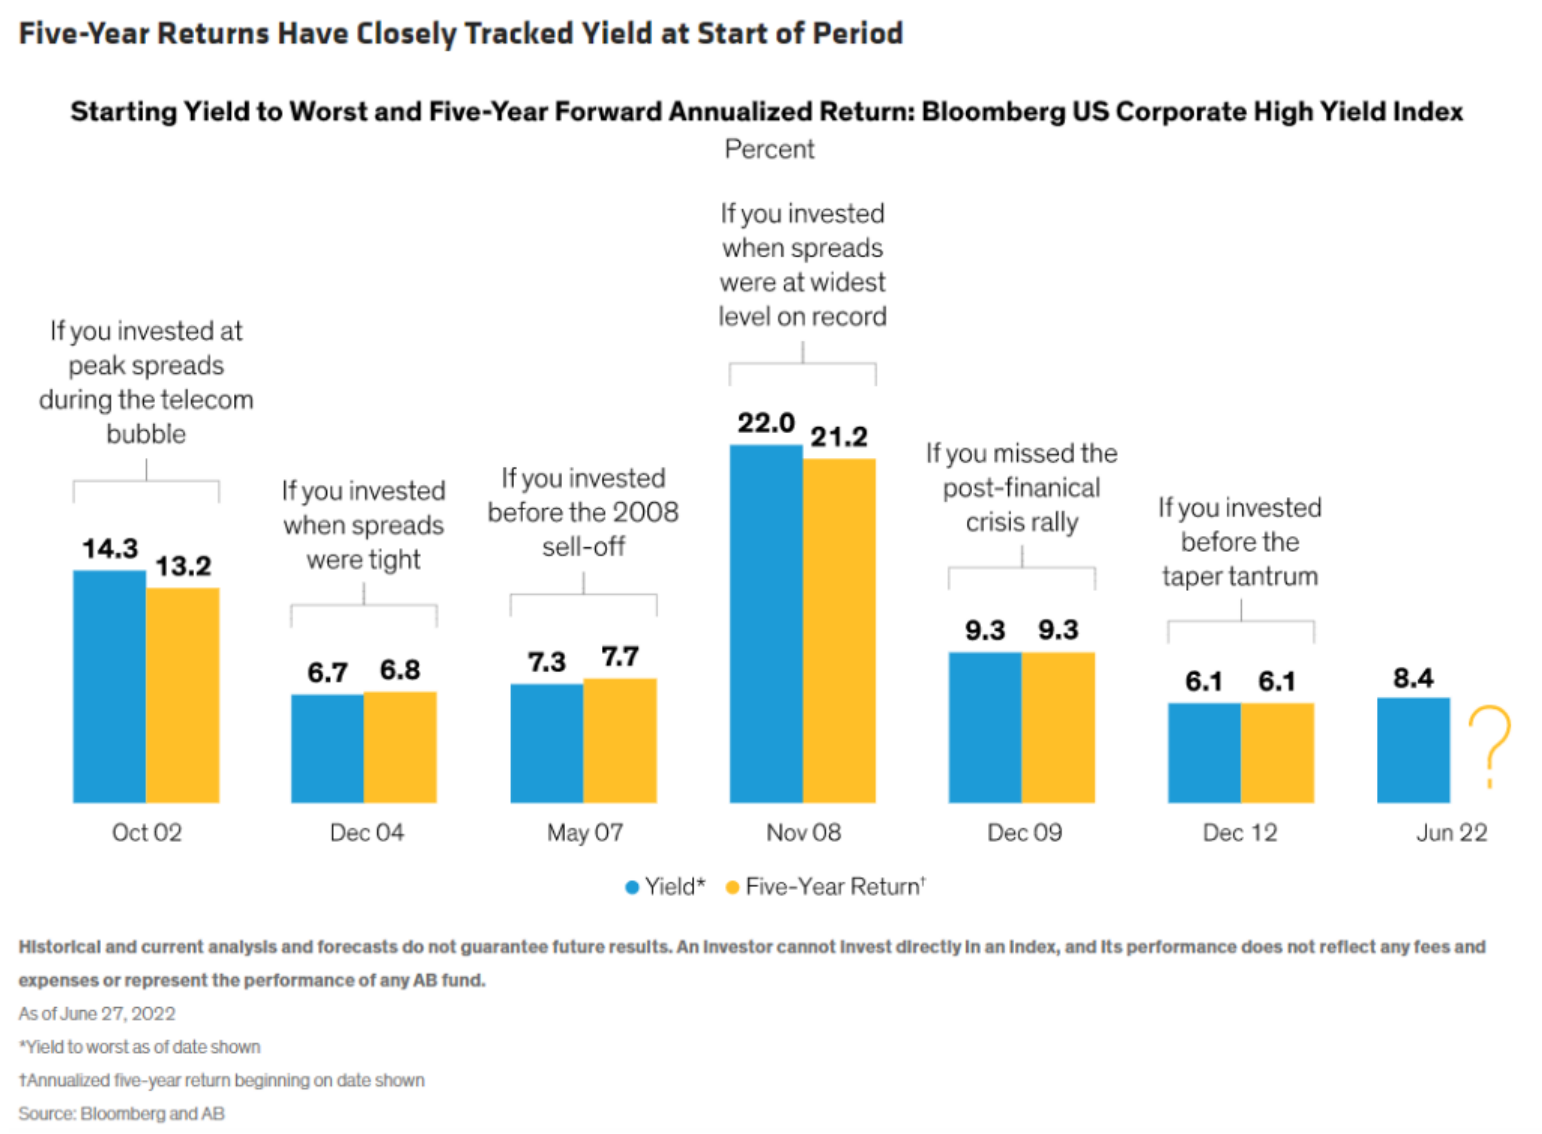
High-yield bond yields are over 8%, leaving them an attractive option versus historical performance. As you can see on the following chart, yields have a high correlation to 5-year returns. As a side note, if we get another down draft in stock market 2023, we may see double-digit yields in junk bonds which would be a historical, maybe generational, opportunity to buy this asset class. Speak to a bond market professional before investing in this space.
Disclosures
Lansing Street Advisors, LLC is a registered investment advisor with the State of Pennsylvania. You can read more about the Lansing team at www.lansingadv.com .
To the extent that content includes references to securities, those references do not constitute an offer or solicitation to buy, sell or hold such security as information is provided for educational purposes only. Articles should not be considered investment advice and the information contained within should not be relied upon in assessing whether to invest in any securities or asset classes mentioned. Articles have been prepared without regard to the individual financial circumstances and objectives of persons who receive it. Securities discussed may not be suitable for all investors. Please keep in mind that a company’s past financial performance, including the performance of its share price, does not guarantee future results.
Material compiled by Lansing is based on publicly available data at the time of compilation. Lansing makes no warranties or representations of any kind relating to the accuracy, completeness or timeliness of the data and shall not have liability for any damages of any kind relating to the use of such data.
Material for market review represents an assessment of the market environment at a specific point in time and is not intended to be forecast of future events or guarantee of future results.
Indices that may be included herein are unmanaged indices and one cannot directly invest in an index. Index returns do not reflect the impact of any management fees, transaction costs or expenses. The index information included herein is for illustrative purposes only.
The trademarks and service marks contained herein are the property of their respective owners.
Lansing Street Advisors is a registered investment adviser. Information presented is for educational purposes only and does not intend to make an offer or solicitation for the sale or purchase of any specific securities, investments, or investment strategies. Investments involve risk and, unless otherwise stated, are not guaranteed. Be sure to first consult with a qualified financial adviser and/or tax professional before implementing any strategy discussed herein. Past performance is not indicative of future performance.
Lansing Street Advisors may discuss and display, charts, graphs, formulas which are not intended to be used by themselves to determine which securities to buy or sell, or when to buy or sell them. Such charts and graphs offer limited information and should not be used on their own to make investment decisions.
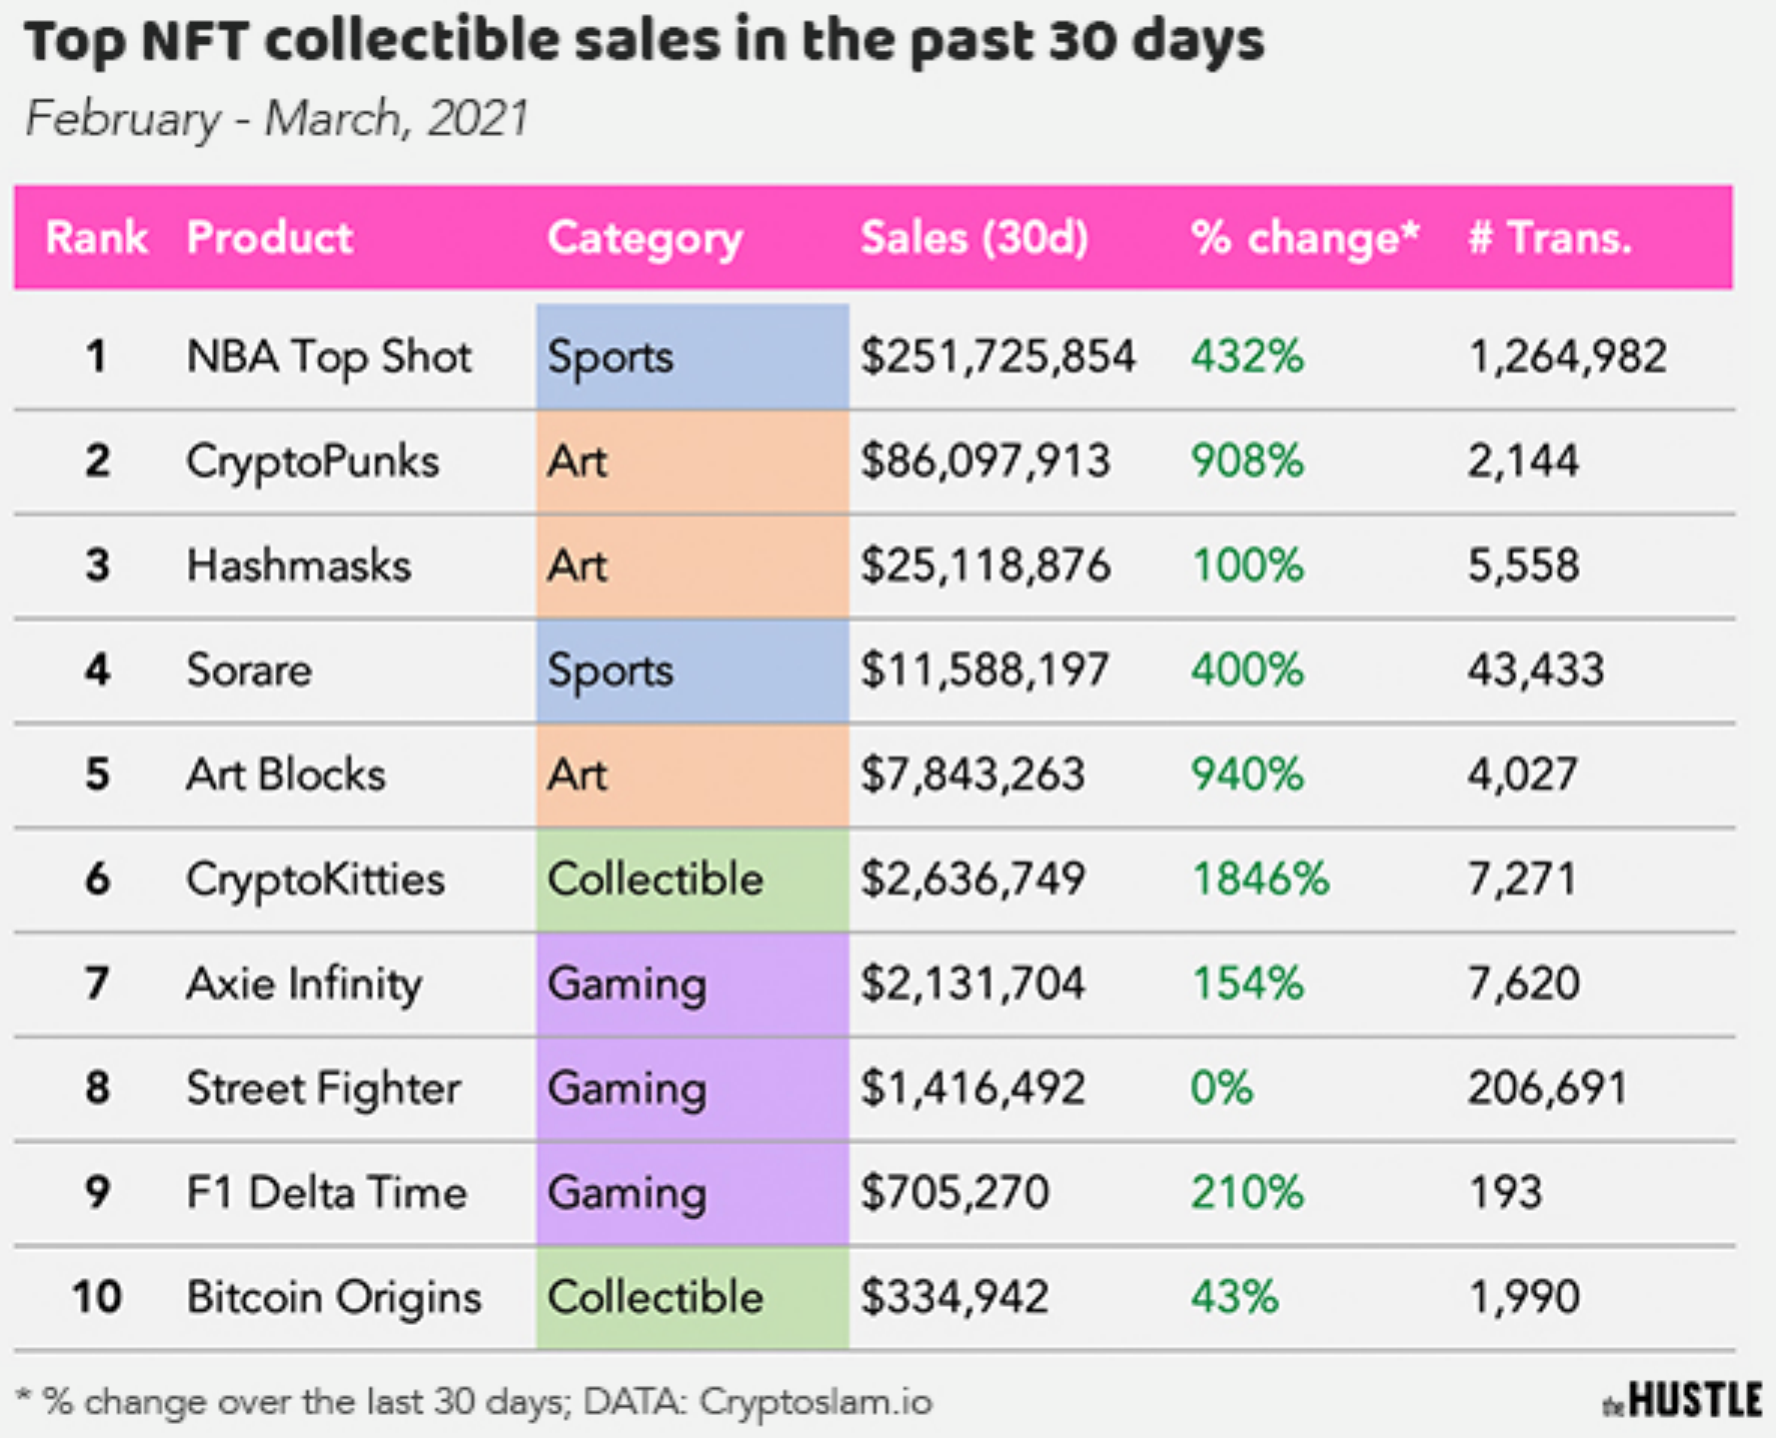
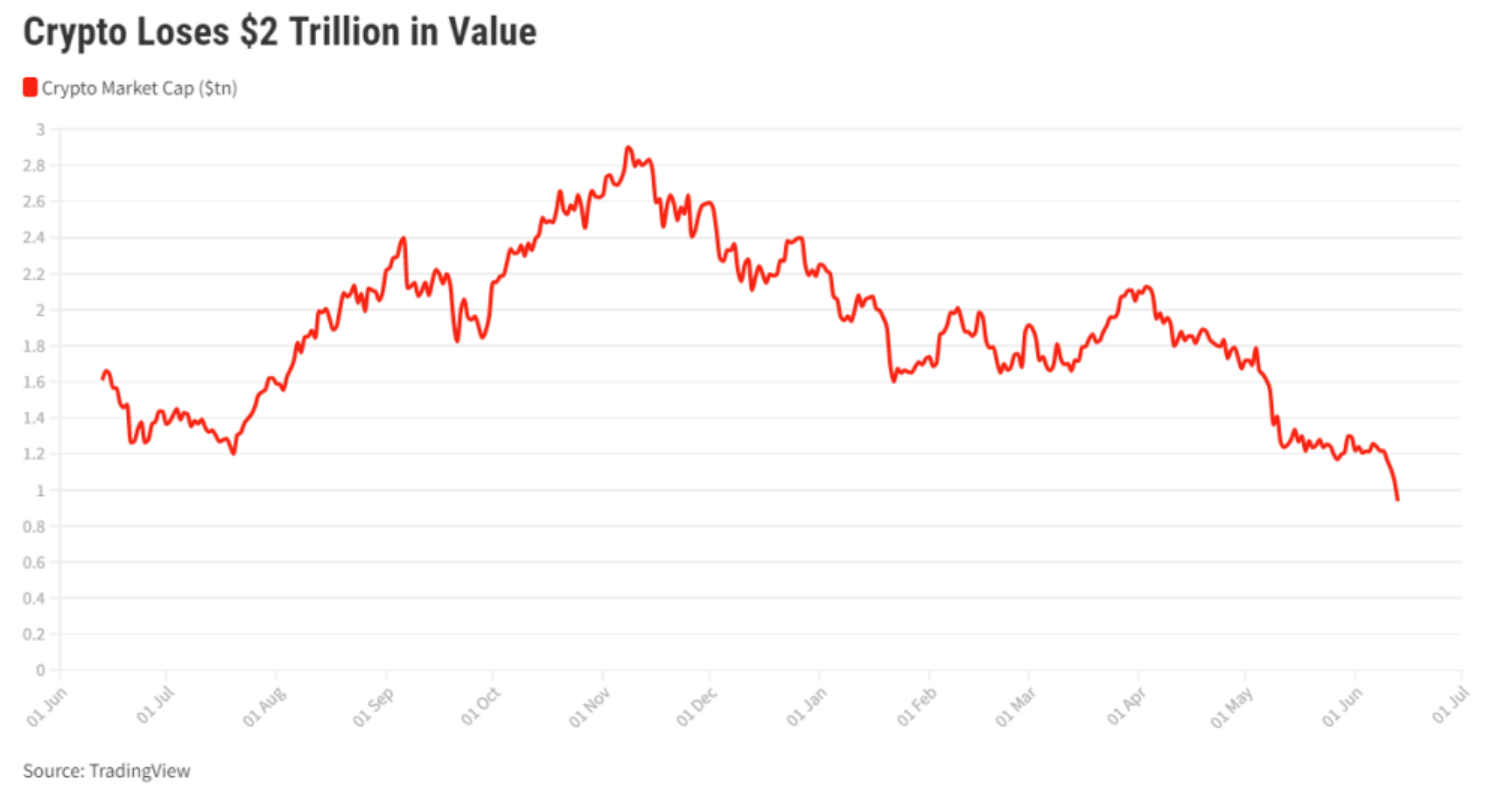
The bubble star of this bull market was crypto, but as soon as the FED started raising rates, the story imploded - erasing $2 Trillion of its value within 10 months. Currently, Crypto has failed as a currency, a digital gold, and a technology to remove the middleman. For the immediate future, we will be sorting out who goes to jail.
Bitcoin $2 Trillion Wiped Out
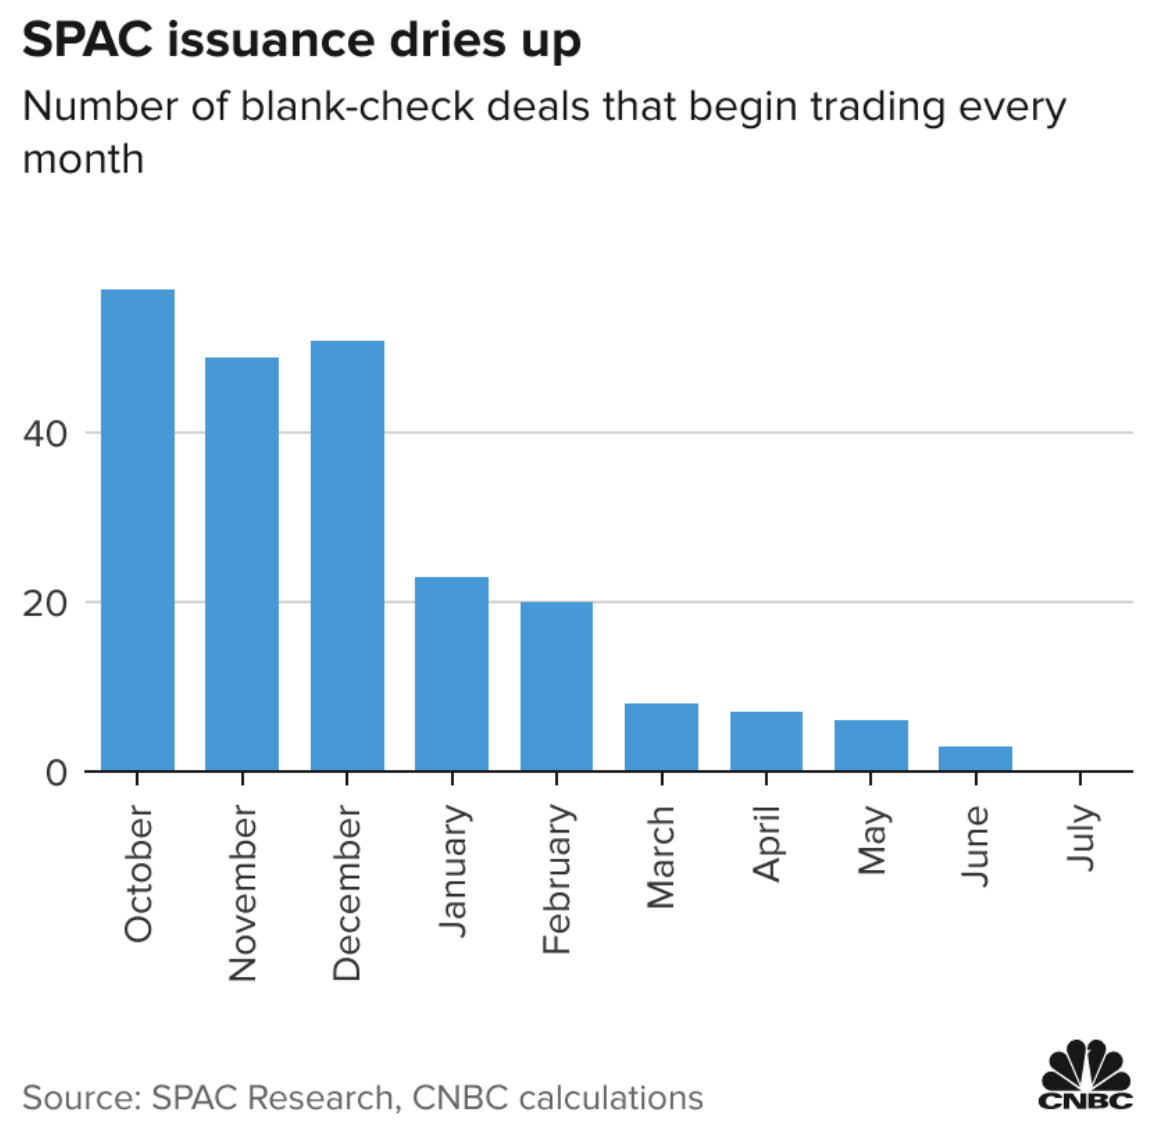
SPAC Bust
- Zero New SPAC Deals by Summer 2022
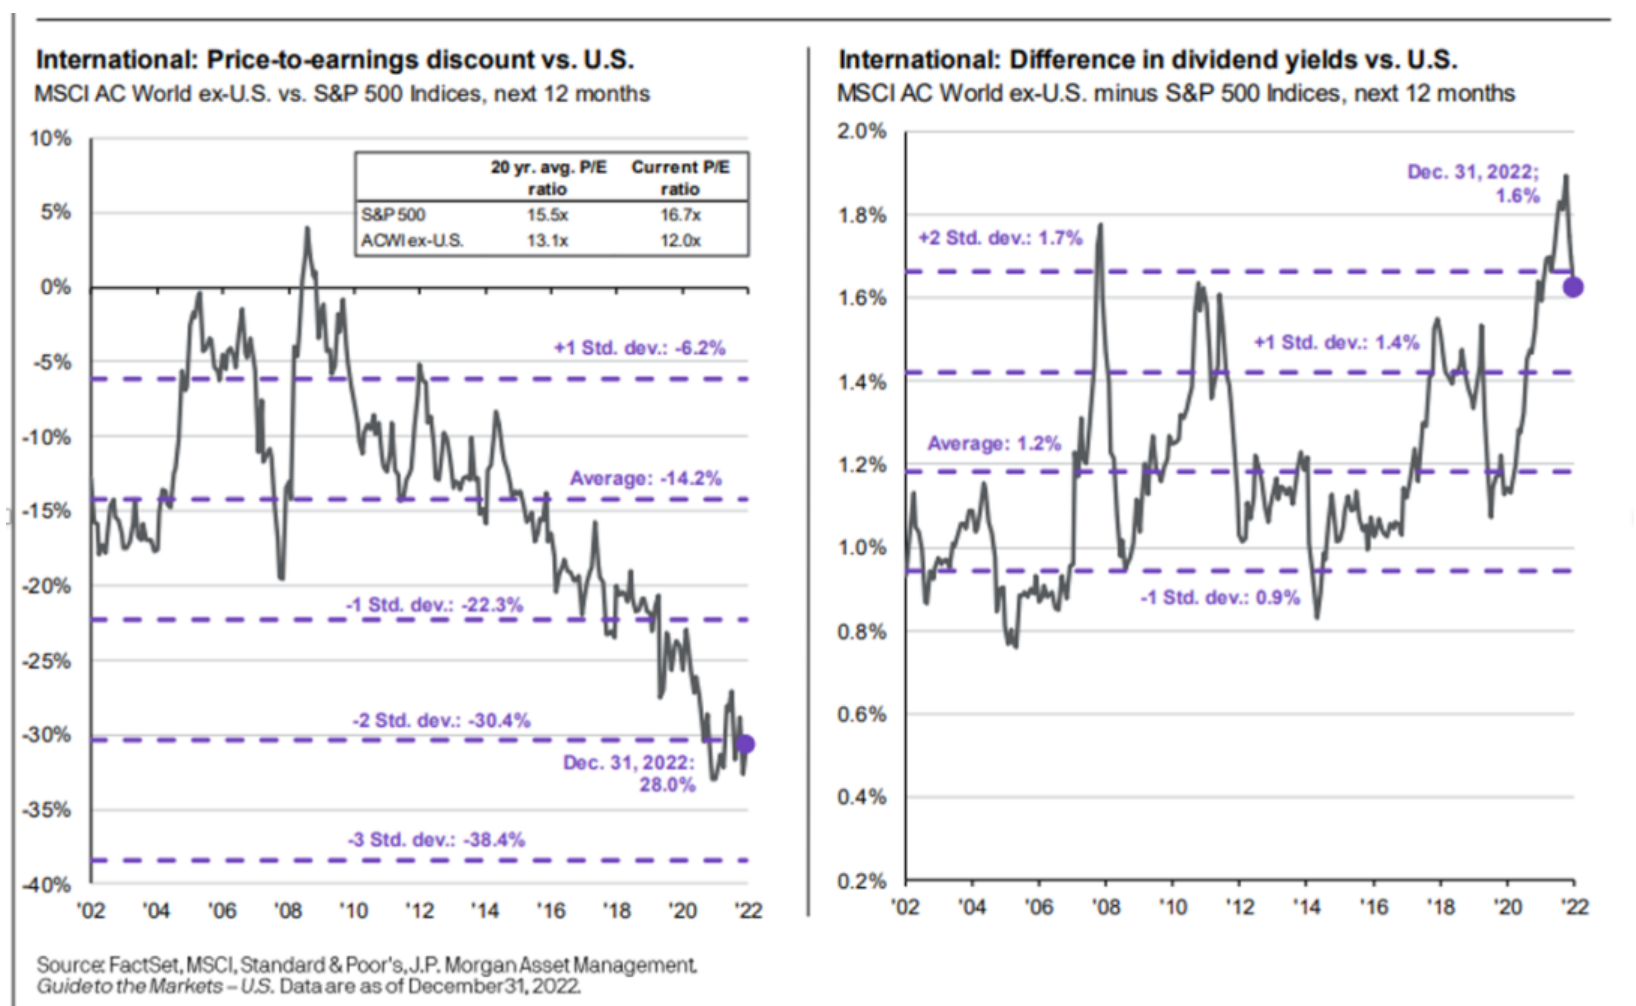
For 14 years the S&P 500 performance has clobbered international stocks, leaving valuations skewed to historical extremes. Below, the JP Morgan chart on the left shows price-to-earnings discounts of international stocks at 20-year record lows - a two-standard deviation event. The chart on right presents another two standard deviation outcomes with the difference in dividend yields. A weakening dollar is a positive for international stocks as their currencies are also cheap vs. U.S. currency. Speak to an investment professional before exploring international equities.
https://finance.yahoo.com/news/ipo-slump-bankers-wary-2023-100000599.html
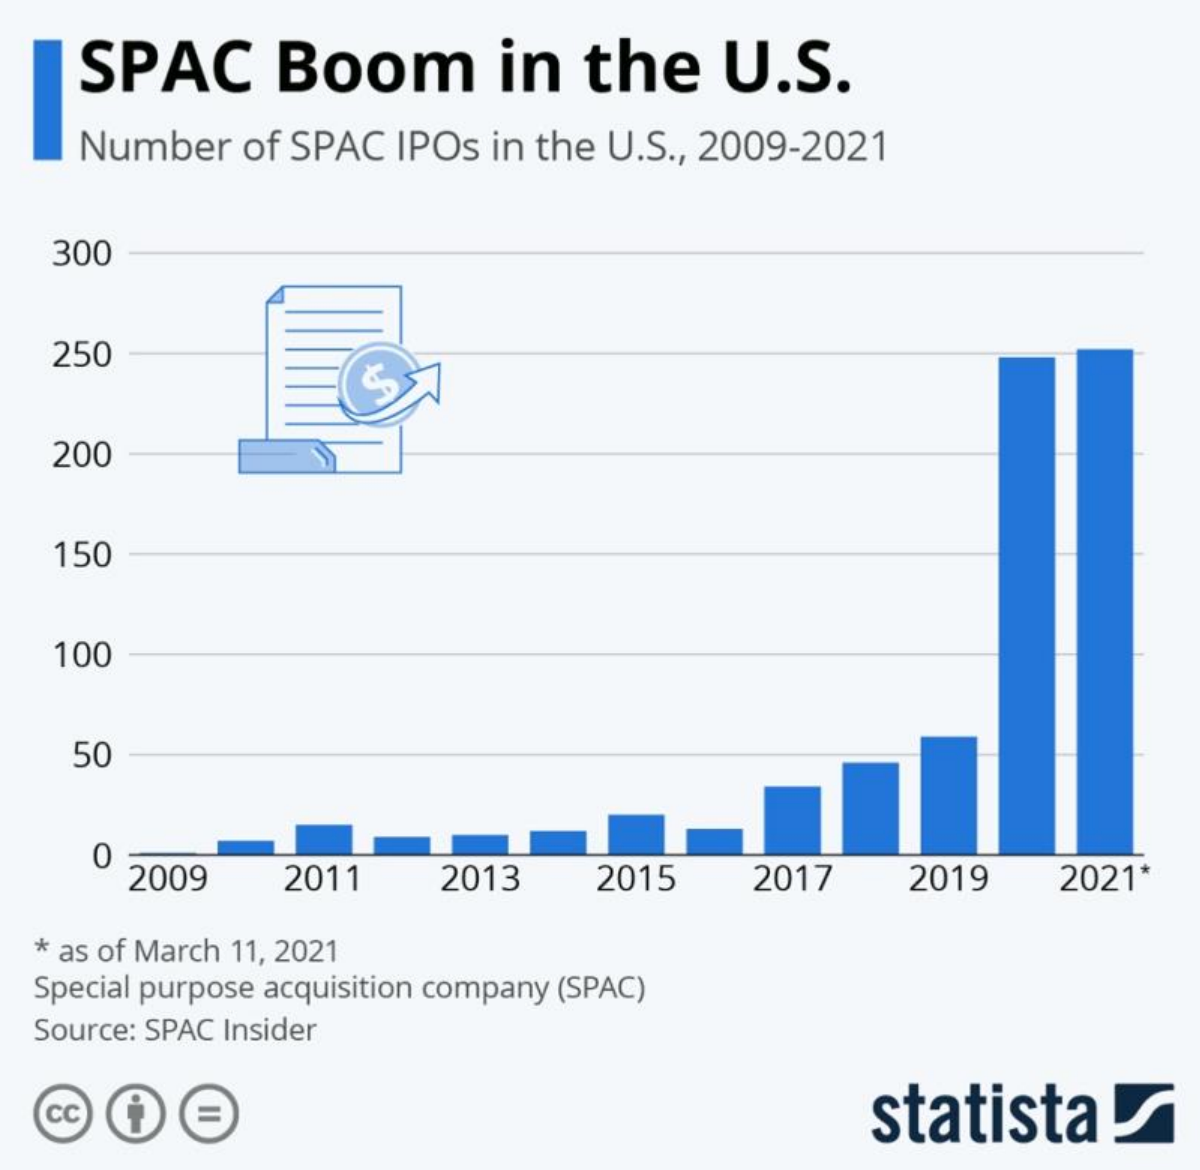
SPAC Boom
- SPACS are IPOs with less regulation and higher fees, so safe to say that if the IPO market shuts down, the SPAC market is toast. Burnt toast in this case with my guess being we will not hear of SPACS again for at least another decade. By July, there were zero new SPACS issued.
Especially important, none of the above are a recommendations for you to buy or sell any security. This is for information purposes only. Please talk with your advisor regarding any advice around the subject matter and your goals.
Source:
Musixmatch
https://chatstorm.substack.com/p/weekly-s-and-p500-chartstorm-9-october
Part I - Inflation Drop
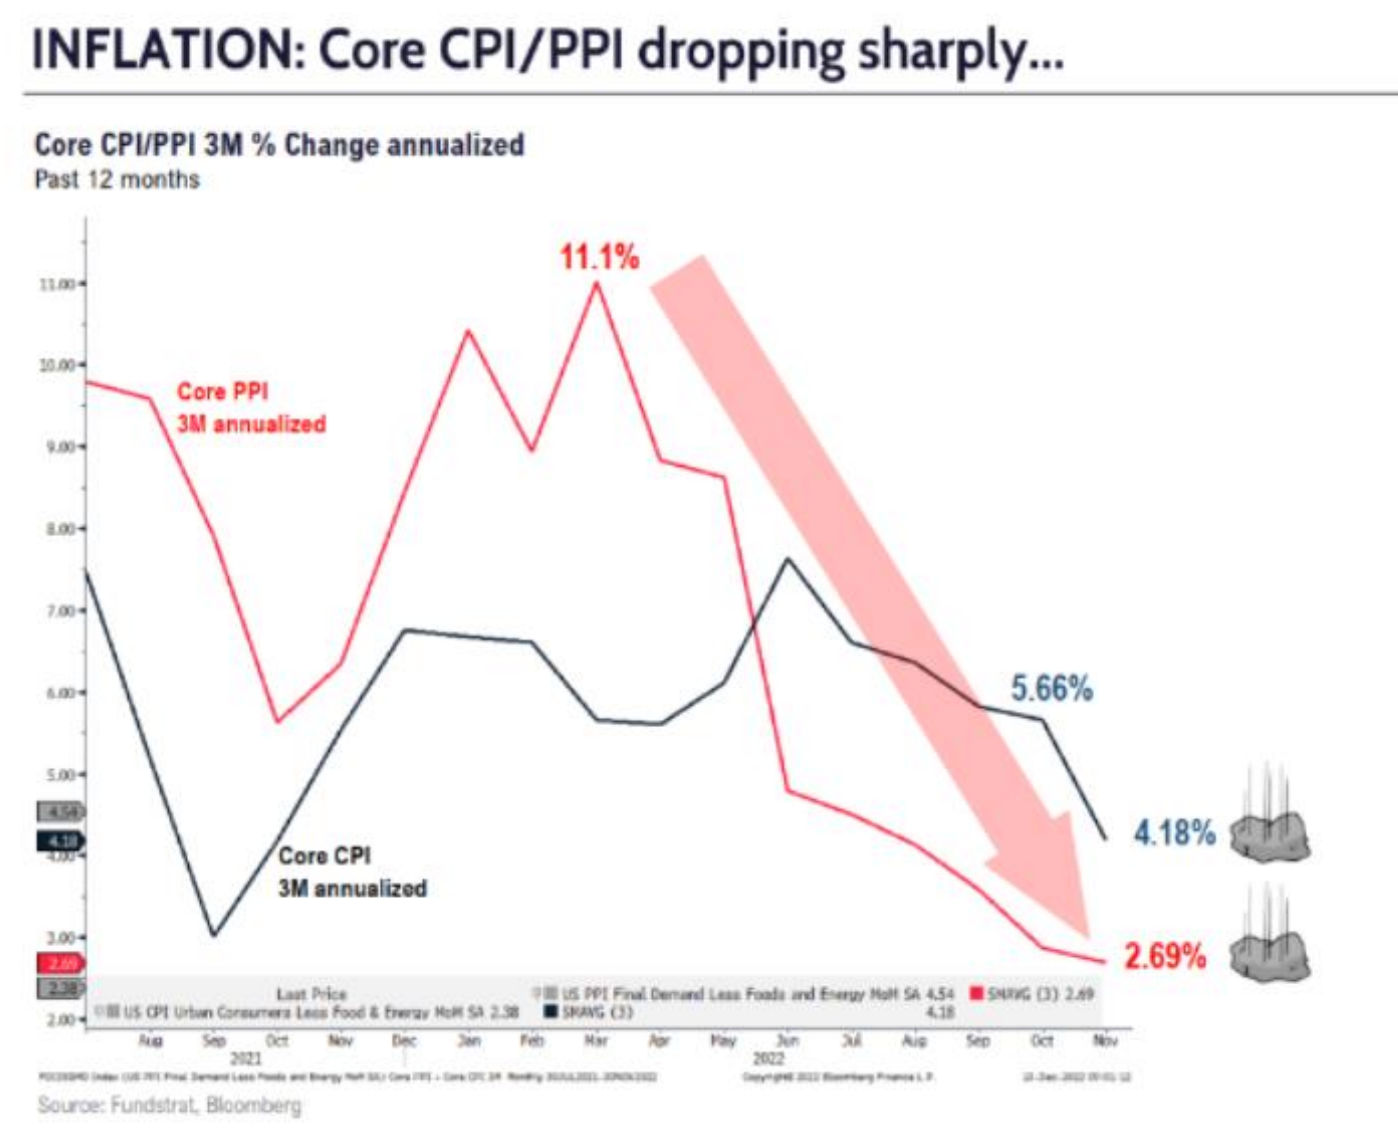
As a follow-up to my Q3 letter, inflation is not just dropping, it's down 50% from highs according to CPI/PPI numbers. Rents are now falling which has a lagged effect on overall inflation data so this number should move even lower. This leads to our skepticism regarding the historical comparison to the runaway inflation of the 1970s. Paul Volcker’s name was mentioned more than Lebron James in last 6 months - that may work for the shock factor but the economic comparisons of the 1970s to 2022 don’t hold up.
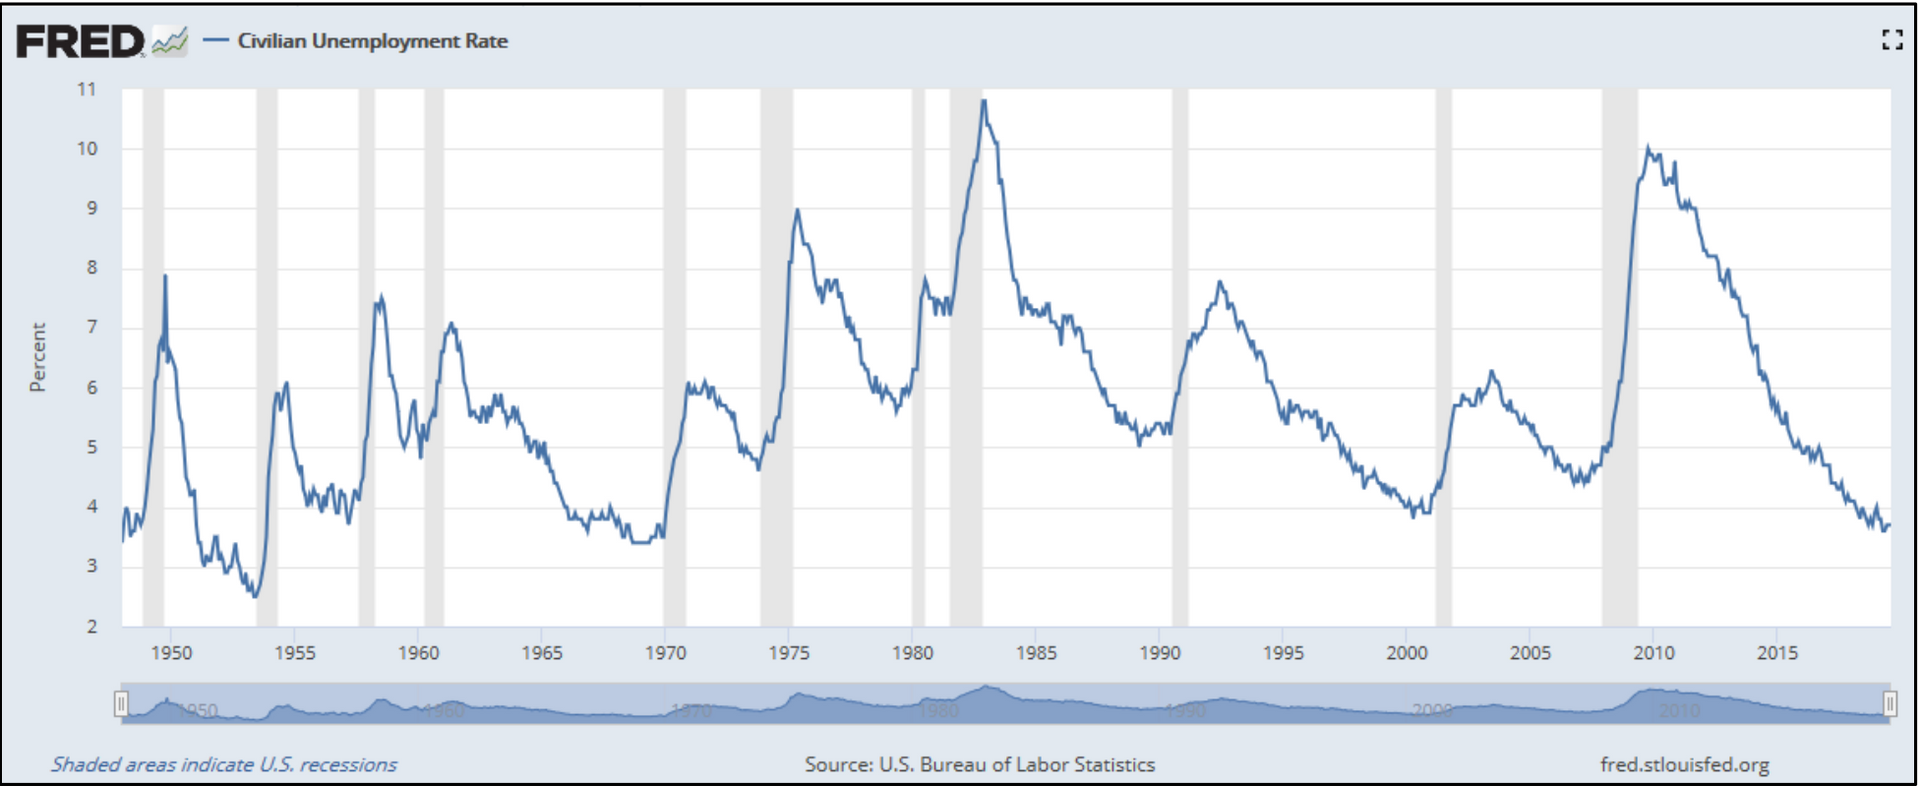
I will leave it to the academics to write white papers on this topic but just the drop in energy as a percentage of GDP and a far less labor-intensive economy destruct the 70’s style inflation thesis.
Reuters Oil intensity -- the volume of oil consumed per unit of gross domestic product -- dropped 56% between 1973 and 2019, according to Columbia University's Center for Global Energy Policy. Oil averaged more than $100 a barrel between 2010 and 2015 and the global economy and markets held up fine, note JPMorgan strategists Marko Kolanovic and Bram Kaplan.
So, if in 1973 it took a little under one barrel of oil to produce $1,000 of economic output, that figure has fallen to less than half a barrel.
Last,
the continuing theme of Lansing Street Advisors in the last 24 months of quarterly letters is the reversion to the mean. Be prepared for lower but acceptable returns versus the last 10 years. Also, be primed for a change in leadership from the public markets. See below, the constant theme from my letters - Vanguard projected returns based on math for the next 10 years. American growth stock darlings of the last decade have the lowest projected returns on the board - this could change with a bigger sell-off or lower interest rates, but the market Gods are everchanging.
https://advisors.vanguard.com/insights/article/marketperspectivesseptember2022
Conclusion
In my 25 years plus investment career, the markets express a few things: excellent long-term returns through the power of compounding, a plethora of short-term volatility, a test in psychology not IQ through controlling your emotions, reversion to the mean in valuations, and a path to profitability by going against the crowd.
Outperformance is far from easy. Warren Buffett reads 500 pages a day preparing to invest, is universally accepted as the greatest investor of all time and his firm still goes through 10-year periods of massive underperformance. However, there are some basics that work.
Some of those staple investing rules will come into play in the next 10 years as new leadership sectors and asset classes outperform the winners of 2012-2022. An investor has two choices: follow the mantra that diversifying is the only free lunch in investing or seek professional investment advice in this changing time. Right now, the masses have stopped buying stocks and shifted their purchases to U.S. ›guaranteed 3-month to 12-month treasuries which promise that you won’t lose money next year but not that you will outperform inflation for the next 10 years.